By VIRGINIA A. ISHLER
Milk and feed price volatility can have an adverse impact on a dairy farm's profitability. If milk prices drop and feed costs rise, farm profits can be squeezed. In some years, milk prices can be very low, resulting in a need to more carefully monitor feed costs to maintain a sustainable margin. In other years, milk prices could increase because of market spikes in feed costs, which also requires careful monitoring since milk prices may not rise fast enough to keep up with higher feed costs.
Dairy producers do have control over milk prices and feed costs. Both can be forward contracted through a milk cooperative and a feed grain supplier. Farms that are large enough can also directly contract their milk and feed prices through a commodity broker. In addition, dairy producers can benchmark their feed budget, monitor purchased feed costs, and implement good feed management practices to maintain an ideal feed efficiency.
Over the past two decades feed costs have ranged between 30 to 70 percent of the total cost of producing milk. In 2009 when milk prices were extremely low and feed costs reasonable, it was difficult to maintain a sustainable margin. In 2012, feed costs erupted, but with reasonable milk prices producers had more maneuvering room to keep margins in line. However, since 2015 milk prices have not kept pace with feed costs that have been trending higher compared to the early 2000s. Developing a system to monitor and budget milk and feed prices is essential to maintaining control over gross profits.
There are two measures for monitoring milk prices and feed costs. Income over feed costs (IOFC) is measured in dollars per cow per day. The other is milk margin (MM), which is measured in dollars per hundredweight (cwt) per day. Both reflect the difference between the price of milk and the cost of the feed to make that milk. While IOFC is on a per-cow, per-day basis, the milk margin is on a per-cwt basis. Dairy producers usually monitor and measure IOFC, whereas other market participants (e.g., those trading futures contracts in Chicago, processors, government) will be more interested in the milk margin. IOFC and MM are simply a mathematical transformation of the other; when one goes up, so will the other. This publication will focus on IOFC.
Measuring Milk and Feed Costs
There are various ways to measure milk and feed costs. USDA has a measure called the milk-feed ratio. According to USDA, the milk-feed ratio is the number of pounds of 16 percent protein-mixed dairy feed equal in value to 1 pound of whole milk. Another interpretation is the number of pounds of feed that can be purchased with the revenue generated by 1 pound of milk. The methodology uses major raw feed component prices from Agricultural Prices, published by USDA's National Agricultural Statistics Service (NASS). The price of a prepared complete dairy feed is based on current United States prices received for corn, soybeans, and alfalfa. The modeled feed uses 51 percent corn, 8 percent soybeans, and 41 percent alfalfa. The formal definition for this formula is as follows:
FV = (51/56) x PCorn + (8/60) x PSoy + (41/2000) x PHay
Milk-feed ratio = PMilk/FV
FV is feed value ($/cwt), PCorn is the price of corn ($/bu.), PSoy is the price of soybeans ($/bu.), PHay is the price of alfalfa hay ($/ton), and PMilk is the U.S. all-milk price ($/cwt).
Example: Calculation for November 2021: 51/56 * $5.27/bu. + 8/60 * $12.20/bu. + 41/2000 * $210 = $10.74/cwt
Milk-feed ratio = $20.80/cwt / $10.74/cwt = 1.94
A challenge using the milk-feed ratio is that it is not very intuitive. As an index, it is simply a ratio of two numbers. It is difficult for producers to relate this index to their operations. It does not reflect dollars and cents but rather a ratio that is equal to something that cannot be readily identified. For example, the milk-feed ratio in November 2021 was 1.94 compared to 2.58 in November 2020. It provides a broad overview of how the milk and feed prices are trending in the US but has little significance to the producer. For example, Pennsylvania only reports corn and alfalfa hay prices and no soybean price, so it is difficult to assess what is happening even in a particular state. This ratio has limited relevance when trying to determine if dairy producers are making money in the current market environment.
An alternative approach is to calculate milk income per cow and subtract the milk cow feed cost per cow. For example, if a dairy operation averages 85 pounds of milk per cow per day, what is the milk income using the gross milk price and what is the feed cost to produce the milk? The result is a dollar figure that represents gross profitability for the dairy farm. The IOFC must cover expenses such as labor, fuel, debt, supplies, and so forth. Ideally, the IOFC should be compared to the operation's breakeven IOFC using actual costs for home raised feeds. However, if the breakeven number is not available, IOFC can be calculated using market prices and compared to cohorts to evaluate if feed costs are in line with the level of production.
IOFC is measured on a per-cow basis and is defined as follows:
IOFC ($/cow/day) = Pmilk x (DAMP/100) – DFC
Pmilk is the gross milk price ($/cwt), DAMP is daily average milk production (lbs./cow/day), and DFC is daily feed costs ($/cow/day). DFC is the daily cost of feedstuffs required to produce the amount of milk reflected in DAMP. The all-milk price is being converted from dollars per cwt to dollars per pound of milk produced, and then the cost of producing that milk is subtracted.
Example – IOFC for a herd averaging 77 pounds of milk with a gross milk price of $18.00/cwt and a milk cow feed cost of $5.40/cow.
IOFC = $18.00 x (77/100) – $5.40 = $8.46/cow
The milk margin is measured in dollars per cwt and is defined as follows:
MM ($/cwt) = Pmilk – DFC x 100/ DAMP
Example – MM for a herd averaging 77 pounds of milk with a gross milk price of $18.00/cwt and a milk cow feed cost of $5.40/cow.
MM = $18.00 - $5.40 x (100/77) = $10.99/cwt
Feed costs are converted from a cost-per-cow to a cost-per-cwt basis when calculating MM. As indicated in the examples, these measures of gross profitability (both IOFC and MM) are very different from USDA’s measure of the milk margin because the latter reflects the cost of 100 pounds of feed—not the feed cost of producing milk. One limitation with the measure of gross profit (both IOFC and MM) is that it only reflects the feed costs for the milking cow, which is roughly 40 percent of the milk income. This is based on market prices and reflects the past decade (V. Ishler, 2022). This does not include feed for dry cows and dairy replacements. If these feed costs were included, it would represent approximately 50 to 60 percent of the milk income. If the dairy's actual costs for home-raised feeds were used, these percentages could be lower.
Feed Rations
The concept of IOFC is a simple approach for a dollars-and-cents measure of gross profitability for the milk producer.
But how much detail is necessary when developing a way to measure feed costs? Dairy feed rations consist of three parts: forages (hay, corn silage, haylage), concentrates (corn, soybean meal, minerals), and by-products (wheat midds, distiller's grains). Rations are balanced to produce a certain level of milk production and components (milk fat and protein). There are many combinations of feedstuffs used to formulate a ration.
The USDA ration used to compute the milk-feed ratio is very simple. It uses monthly USDA-NASS reported prices for corn, soybeans, and alfalfa hay to compute the cost of 100 pounds of a 16 percent protein dairy ration. NASS used Morrison's Feed and Feeding Manual and computed that 100 pounds of a 16 percent ration should contain 51 pounds of corn, 8 pounds of soybeans, and 41 pounds of alfalfa hay. The challenge with this approach is the simplicity of the ration and not being representative of a typical diet fed by dairy producers. Soybean meal is the common protein source utilized by dairies compared to raw soybeans. If soybeans are fed, they are heat treated (e.g., roasting). Also, most rations consist of by-product feeds.
Penn State designed a study evaluating a feed ration for a Pennsylvania farm that feeds alfalfa-grass mixed haylage, corn silage, corn grain, 48 percent soybean meal, distiller's grain, soybean hulls, roasted soybeans, and a mineral mix. This ration was called the PA Complex ration (Table 1). Rations were formulated for cows averaging 65, 75, or 85 pounds of milk with a 3.7 percent milk fat and 3.0 percent milk protein. Dry matter intake was estimated using the 2001 National Research Council (NRC) model. All rations contained approximately 50 percent forage and 50 percent concentrate on a dry matter basis. Historical feed prices (Feedstuffs's magazine, Pennsylvania Department of Agriculture, and Keystone Dairy Digest) were obtained from the Penn State feed price list, which is published monthly (V. Ishler, 2022). Over the years the source of feed prices has changed. Currently, this list compiles prices from the Ag Market News, LLC, USDA, and Glowlit. The IOFC measure uses both the price of milk and the cost of feed. The Pennsylvania all-milk price used is reported by NASS. IOFC was determined by taking the Pennsylvania all-milk price minus the cost of feed.
Table 1. Pennsylvania complex and simple rations (65, 75, and 85 pounds of milk).
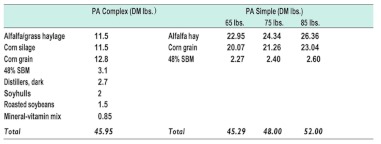
The second component of the study was taking the same levels of milk production and milk components and using just alfalfa hay, corn grain, and 48 percent soybean meal (Table 1). The objective was to compare the IOFC for the very simple ration (PA Simple) to the more complex ration. Finally, a ration was designed to mimic the USDA’s milk-feed ratio. This ration was designed to use Chicago prices for corn, 48 percent soybean meal, and alfalfa hay. On an "as fed basis" this ration used 22.22 pounds of corn grain, 2.52 pounds of 48 percent soybean meal, and 25.5 pounds of alfalfa hay to produce 65 pounds of milk. The U.S. all-milk price was used. This was called the US Simple ration. IOFC was determined by taking the all-milk price minus the cost of feed. These three measures of IOFC were computed for this study using the feed rations: PA Complex, PA Simple and US Simple.
Reliability of IOFC
Each ration was paired with a measure of the milk price to determine a unique estimate of IOFC. The following questions were answered:
- How does IOFC computed from the more complex Pennsylvania feed ration compared to the simple Pennsylvania feed ration?
- How do the Pennsylvania measures of IOFC compare to the IOFC computed from the US Simple ration?
- How do all three rations compare to the USDA’s milk-feed ratio?
Figure 1 shows these comparisons using the rations balanced for 65 pounds of milk. All three measures of IOFC are highly correlated and as one measure goes up, so do the other two and vice versa.
Figure 1. Monthly comparison of USDA's milk-feed price ratio and IOFC using the 65-pound milk production level.
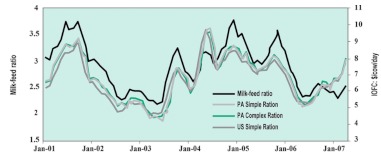
The two Pennsylvania measures of IOFC are very similar, and the US Simple measure is very close to the two Pennsylvania measures in dollar terms. The only difference is a matter of basis. The USDA's milk-feed ratio is highly correlated with the measures of IOFC in most months, but not all (note the divergence in 2007). The last comparison is the degree of correlation of the four-time series. IOFC for the two Pennsylvania rations and for the U.S. ration were compared to the time series for the milk-feed ratio. The estimated correlation coefficients are presented in Table 2.
Table 2. Correlation measures for the milk-feed ratio and IOFC.
Milk-Feed Ratio1
| | Milk Feed Ratio | PA IOFC Simple (65 pounds) | PA IOFC Complex (65 pounds) |
|---|
| Milk-Feed Ratio | 1 | | |
| PA IOFC Simple (65 pounds) | 0.864749066 | 1 | |
| PA IOFC Complex (65 pounds) | 0.861574173 | 0.996351949 | 1 |
| US IOFC Simple (65 pounds) | 0.842164518 | 0.972726177 | 0.969092499 |
The results indicate that the three measures of IOFC for Pennsylvania and the United States are highly correlated, having estimated correlation coefficients greater than 97 percent. The milk-feed ratio is also highly correlated with these measures of IOFC, having correlation coefficient estimates of 84 to 86 percent.
When this study was conducted in 2007, the 65-pound level most closely matched the average milk production in Pennsylvania. For 2006, NASS reported the average milk production for Pennsylvania at 19,390 pounds. However, over the years milk production has increased. For 2020, NASS reported the average milk production at 21,320 pounds. Using the 75-pound level is now more appropriate and Figure 2 shows the comparison with the 65-pound milk production level and USDA's milk-feed price ratio. The PA Simple ration for both production levels track very similarly. Since 2014, the milk-feed price ratio has tracked very closely with the 75-pound milk production level.
Figure 2. Annual comparison of USDA's milk-feed price ratio and IOFC using the 65 and 75-pound milk production level.

Benchmarking IOFC
To operate a profitable business and make sound business decisions, IOFC is an easy benchmark to monitor. It is affected by feed costs, milk production, and milk price. The goal is to maintain an IOFC that exceeds the farm's breakeven IOFC. The approach of solely focusing on reducing feed costs when feed costs are high is rarely a smart decision. If milk production is compromised due to cutting out-of-pocket feed costs, IOFC can be further reduced, lowering overall farm profitability. Maximizing IOFC may require evaluating different feeding strategies and following the expertise of a nutritionist before implementing major changes.
Dairy operations should benchmark IOFC against their own farm. Table 3 illustrates the average IOFC and MM for the past five years and 20 years for the three milk production levels. Based on the milk and feed markets, there has not been a lot of change. Because each farm is different and has varying debt loads, the IOFC to maintain a farm's profitability may need to be higher than the benchmarks. Producers should calculate IOFC each month as milk production, milk price, and feed costs change. Benchmarking this measure against past performance and future goals will help the producer make favorable, economically beneficial decisions for the dairy.
Table 3. Pennsylvania's 5-year and 20-year average for IOFC and MM
5 year average (2016-2020)
| | PA Simple Ration
65 | PA Simple Ration
75 | PA Simple Ration
85 |
|---|
| PA All-Milk Price | $18.00 | $18.00 | $18.00 |
| IOFC/cow | $ 7.30 | $ 8.83 | $10.23 |
| MM/cwt | $11.22 | $11.77 | $12.04 |
20 year average (2001-2020)
| | PA Simple Ration
65 | PA Simple Ration
75 | PA Simple Ration
85 |
|---|
| PA All-Milk Price | $18.14 | $18.14 | $18.14 |
| IOFC/cow | $ 7.46 | $ 9.02 | $10.44 |
| MM/cwt | $11.48 | $12.02 | $12.28 |
Using the Futures Markets
One of the benefits of using the US Simple IOFC measure is that the formula and data requirements are straightforward. This index can be computed monthly and then compared to different time periods to draw rough conclusions regarding past and future gross profitability for U.S. dairy producers. For the US Simple measure of IOFC, the feed basis is in Chicago, and the basis for the milk price is simply the difference between the U.S. all-milk price and the Class III milk price. Since there are futures contracts for Class III milk (Chicago Mercantile Exchange) and corn and soybean meal (Chicago Board of Trade), these contract prices can forecast IOFC or help make hedging decisions. These can be compared to the monthly forecast of a long-term average to decide whether forward contracting or hedging these milk and feed prices would be profitable.
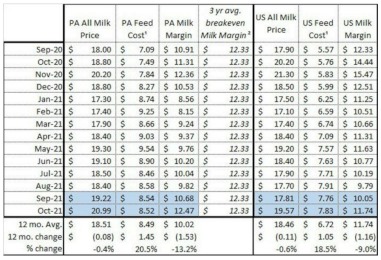
The Penn State Dairy Outlook report describes what is happening in the milk and feed markets. Tables 4 and 5 are from the October 2021 Dairy Outlook report. It shows the trends for the previous months for IOFC/cow and margin/cwt. It uses the following sources for price data:
- All Milk Price: Pennsylvania and U.S. All Milk Price (USDA National Ag Statistics Service, 2022)
- Current Class III and Class IV Price 8/13/2021 and 8/16-8/19/2021 (USDA Ag Marketing Services, 2022)
- Predicted Class III, Class IV Price (CME Group, 2022)
- Alfalfa Hay: Pennsylvania and U.S. monthly Alfalfa Hay Price (USDA National Ag Statistics Service, 2022)
- Corn Grain: Pennsylvania and U.S. monthly Corn Grain Price (USDA National Ag Statistics Service, 2022)
- Soybean Meal: Feed Price List (Ishler, 2022) and average of Decatur, Illinois Rail and Truck Soybean Meal, High Protein prices, National Feedstuffs (USDA Ag Marketing Services, 2022)
Income Over Feed Cost, Margin, and All Milk Price
Table 4: 12-month Pennsylvania and U.S. All Milk Income, Feed Cost, Income over Feed Cost ($/milk cow/day)
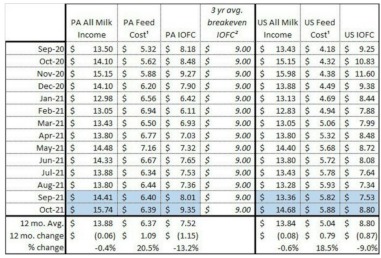
Table 5: 12-month Pennsylvania and U.S. All Milk Price, Feed Cost, Milk Margin ($/cwt for lactating cows)
To look at feed costs and estimated income over feed costs at varying production levels by zip code, there are two mobile applications available from Penn State Extension: DairyCents or DairyCents Pro .
Conclusions
A simple measure of gross profitability has been constructed using IOFC. This metric measures gross profits on a per-cow, per-day basis, whereas the milk margin measures gross profitability on a per-cwt, per-day basis. One measure focuses on the cow and the other on 100 pounds of milk. Both are identical in that one is a simple transformation of the other. IOFC is an alternative measure of milk and feed prices to USDA's milk-feed ratio. There are several advantages when using IOFC. It is more apparent what is being measured using dollars and cents versus a ratio. This is more relevant to a dairy producer. Also, it is a better measure for management purposes since dairy producers can track their monthly IOFC to develop budgetary plans and meet monthly targets. IOFC can be used in conjunction with the futures markets to help milk producers make better decisions regarding when to lock in milk and feed prices. Finally, IOFC is more sensitive to rising feed costs compared to USDA's milk-feed ratio. It appears that USDA’s cost of 100 pounds of feed used in the denominator of the milk-feed index may distort its true representation as a measure of gross farm profitability.
Source : psu.edu