By Scott Irwin and Todd Hubbs
Department of Agricultural and Consumer Economics
University of Illinois
Trend yield projections are foundations of early season forecasts of U.S. corn and soybean production. In two recent farmdoc daily articles (June 11, 2020; June 18, 2020) we investigated the sensitivity of 2020 trend yield estimates to the sample period used to estimate the underlying trend regression model. We found that linear trend yield projections for corn in 2020 can vary by as much as 4 bushels per acre simply based on the starting year used for the estimation period. Similarly, we found that trend yield projections for soybeans can vary by as much as 2.5 bushels per acre. This analysis was based on “unconditional” linear trend regressions that did not account for weather impacts across years, a methodology thought to result in a slight under-estimate of trend yield due to the asymmetric effect of weather on actual yields (e.g., Swanson and Nyankori, 1979). That is, poor weather reduces yields more than good weather improves yields so that the impact of technology (trend) is under-estimated due to sharp reductions in yield from poor weather years. The purpose of this article is to use “conditional” crop weather models to examine the sensitivity of trend projections for the 2020 U.S. average corn and soybean yields to the starting year of the estimation period. This will allow us to directly estimate any bias inherent in unconditional trend regression model estimates.
Analysis
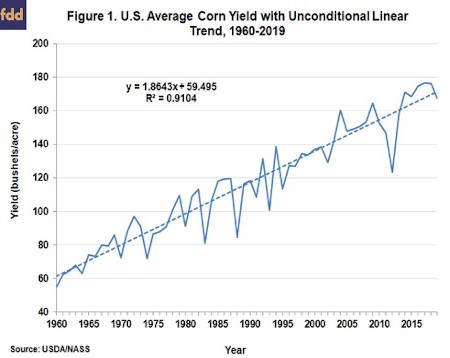
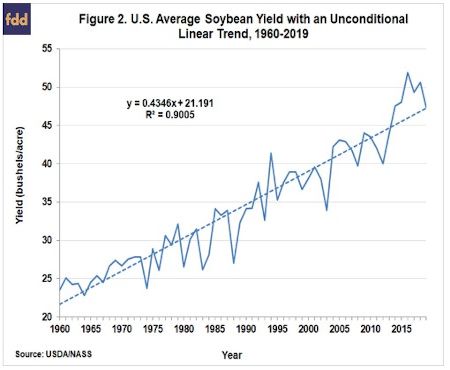
To begin, Figures 1 and 2, respectively, show that U.S. average corn and soybean yields have trended higher since 1960, which we consider to be the starting year of the modern period of crop production. A simple linear trend fit to actual average corn yields over the period explains 91 percent of the variation in annual average yields, and indicates that yields have increased at a rate of 1.9 bushels per acre per year. Similarly, a simple linear trend fit to actual average soybean yields over the period explains 90 percent of the variation in annual average yields, and indicates that yields have increased at a rate of 0.44 bushels per acre per year.
We use in the analysis a version of the crop weather regression models for corn and soybeans specified in these two earlier farmdoc daily articles (May 13, 2020; May 20, 2020) on late planting impacts. The earlier versions related the U.S. average corn or soybean yield to a linear trend, late planting, quadratic functions of preseason (September-March), April, June, July, and August precipitation, and linear functions of April, May, June, July, and August temperatures as explanatory variables. The weather variables are acreage weighted-averages for the Corn Belt. For the present analysis, we reduce the number of variables to only the most important in order to preserve the highest degrees of freedom in smaller estimation samples. Specifically, the revised models relate corn or soybean yield to a linear trend, late planting, a quadratic function of July precipitation, and July temperature. For the full sample period 1960 through 2019, the R2 of the corn model is 97 percent and the soybean model is 94 percent. So, despite the reduced number of variables the explanatory power of the models remains high.
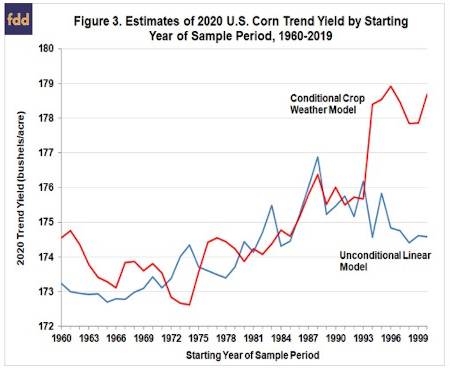
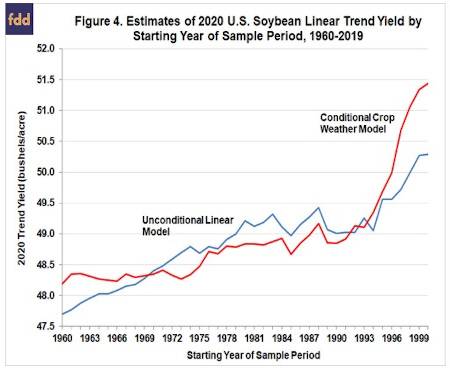
The next step of the analysis is to project corn and soybean trend yields for 2020 by varying the starting year of the crop weather trend estimation. The procedure we follow is: i) estimate the crop weather model for 1960-2019 and project the trend yield for 2020 based on the model estimates (this is the model shown in Figure 1); ii) estimate the crop weather model for 1961-2019 and project the trend yield for 2020 based on the model estimates; and iii) continue this procedure moving the starting year forward one year at a time through 2000. The shortest sample period we consider is 2000-2019 in order to assure that all sample periods have at least 20 observations. This procedure generates 41 separate estimates of the trend for the U.S. average corn and soybean yields in 2020.
One complication when projecting trend yields using the crop weather models is that July precipitation is specified as a quadratic function. This means that one cannot simply plug average July precipitation for the sample period into the model, as is the case for late planting and July temperature, in order to project a trend yield. We use a Monte Carlo simulation in this step in order to reflect the non-linear impact of July precipitation on trend yield estimates.
Figure 3 and 4, respectively, show the projections of 2020 corn and soybean trend yields by different starting years for the sample estimation period. The estimates for unconditional linear trends from our previous analysis (farmdoc daily, June 11, 2020; June 18, 2020) are also shown for comparison purposes. The patterns are similar for both corn and soybeans. The unconditional and conditional trend estimates are similar for sample periods that start in the 1960s through the 1980s, with the conditional crop weather estimates for corn averaging 0.3 bushels more than the unconditional linear trend estimates and the conditional estimates for soybeans averaging 0.1 bushels less. For these sample periods, there is very little difference between the unconditional and conditional trend estimates for corn and soybeans. In other words, the degree of bias when estimating trend yields due to omitting weather variables from the model is surprisingly small. However, this does not hold for all of the sample periods. Corn and soybean trend estimates from the two models begin to diverge sharply for sample periods starting in the 1990s. For example, the unconditional corn trend yield estimate for the 2000-2019 sample period is 174.6 bushels per acre whereas the conditional crop weather forecast for the same sample is 178.7 bushels.
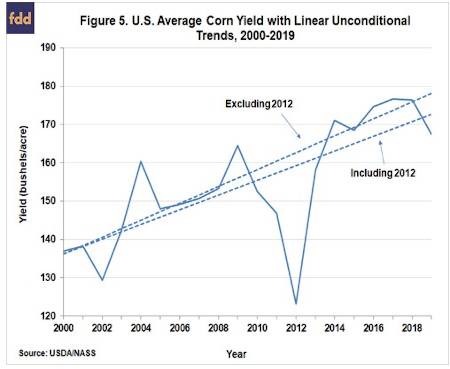
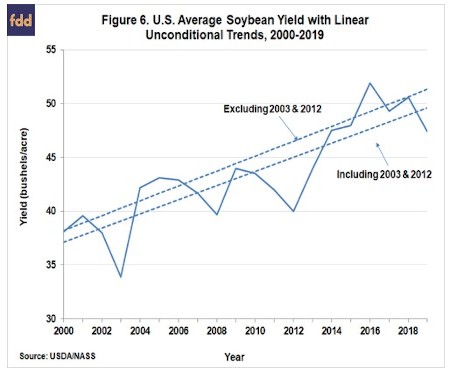
The reason for the divergence of the unconditional and conditional trend estimate for samples beginning in the 1990s is illustrated in Figures 5 and 6. Figure 5 shows the unconditional trend for corn over 2000-2019 with and without 2012, a year of dramatically low yield due to a historic summer drought. Figure 6 shows the same thing for soybeans with and without 2003 and 2012. The 2003 soybean crop was historically low due to dry weather and aphid infestations. Notice the large impact that inclusion of the extremely low yields have on unconditional trend estimates. This happens because the sample period is relatively short and these low yielding years therefore have an inordinate influence on the estimated slope of the trend regression. The problem does not appear with crop weather model trend estimates based on the same sample because the models adjust for the severe weather in these years.
Implications
A variety of methods and data samples can be used to estimate corn and soybean trend yields for the U.S. The most common method is to estimate simple “unconditional” trend estimates based on samples of historical yields, as we did in two recent farmdoc daily articles (June 11, 2020; June 18, 2020). However, unconditional linear trend estimates do not account for weather impacts across years, a methodology that may result in a slight under-estimate of trend yield due to the asymmetric effect of weather on actual yields. We estimate crop weather models for corn and soybeans for sample periods starting in 1960 through 2000 and project “conditional” trend yields for 2020. For all practical purposes, we find no difference in the corn and soybean trend yield estimates from unconditional and conditional models for samples that begin in the 1960s through the 1980s. Hence, for these relatively long samples there does not appear to be any notable bias in simple unconditional trend projections. However, there is a substantial difference in the trend estimates for samples starting in the 1990s, which can be explained by the exaggerated influence of extremely low yields, such as in 2012, on unconditional trend regressions in small samples. This is an important lesson about the dangers of projecting unconditional trends using small samples of data.
Source : illinois.edu