By Gary Schnitkey and Nick Paulson et.al
Department of Agricultural and Consumer Economics
University of Illinois
By Carl Zulauf
Department of Agricultural, Environmental and Development Economics
Ohio State University
Last week, the U.S. Department of Agriculture (USDA) released its baseline projections providing ten-year estimates of supply and demand factors impacting U.S. agriculture. These projections suggest long-run prices of $3.55 per bushel for corn, $9.80 per bushel for soybeans, and $5.10 per bushel for wheat. While these prices are reasonable for long-run budgeting exercises, we also suggest using lower prices of $3.40 for corn, $9.00 for soybeans, and $4.80 for wheat. Long-run prices suggest that soybeans will continue to be more profitable than corn into the foreseeable future.
Background
Annually, the U.S. Department of Agriculture (USDA) produces ten-year baseline projections for crops and livestock grown in the United States (see Baseline Projections). For each crop, supply and demand factors are estimated, along with yearly estimates of market year average (MYA) prices for the U.S. Final projections are typically released in February near the time of USDA’s annual Agricultural Outlet Forum. An archived of historical projections is available here.
In November, USDA provided an early release of their 2020-2030 baseline projection. This early baseline allows assessment of price levels after a tumultuous year when many supply and demand factors were impacted by COVID-19 as well as a host of other supply and demand factors.
In this article, we will make comparisons of the February 2020 projections to the latest November 2020 projections. Importantly, February 2020 projections were released before COVID-19 control measures were in place. New November projections consider COVID-19 controls measures, changes in export and other demand outlooks, as well as relatively full information about 2020 U.S. production. November projections will provide useful information in making long-run forecasts of prices.
Corn, soybean, and wheat forecasts are shown in the following sections. Historical prices from 2000 to 2019 also are shown to provide background. Average prices are calculated from 2013 to 2019 as references for forecasts. Much of the increased use of corn in ethanol occurred by 2013. Thus the 2013-2019 period was judged as a reasonably stable demand period. Historical prices from 2000 to 2019 were obtained from Quick Stats, a website maintained by the National Agricultural Statistical Service (NASS), an agency of the U.S. Department of Agriculture.
Corn Prices
The 2013-2019 average price for corn is $3.67 per bushel (see Figure 1). The 2019 MYA price of $3.56 is below the 2013-2019 average price. The February forecast had projected prices of $3.40 for the 2020 marketing year, with prices rising to $3.60 in 2029. All of these forecasts were below the $3.67 average price for 2013-2019.
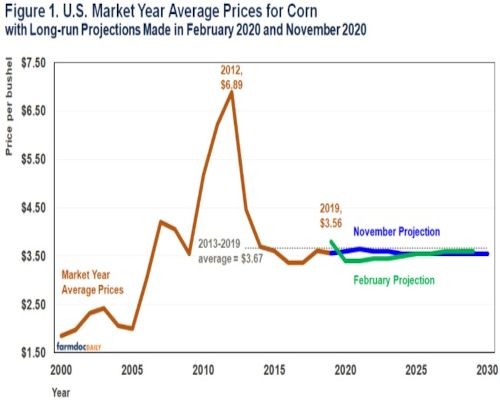
The November forecast has corn prices of $3.60 for 2020, rising to $3.65 in 2021, and then declining to $3.60 in 2022 and 2023, and finally declining to $3.55 for the years of 2024 to 2030. Overall, the November 2020 projections for corn are lower than February 2020 projections for the 2019 marketing year and years after 2026. From 2021 to 2025, the November forecasts are $.05 per bushel higher than the February projections.
Soybean Prices
Soybean prices averaged $9.70 from 2013 to 2019 (see Figure 2). The 2019 MYA price was $8.57, significantly below the 2013-2019 average. The February forecast had soybean prices of $8.85 for 2020, declining to $8.55 in 2021 and 2022, then rising to $9.05 by 2029. All these prices were well below the 2013-2019 average of $9.70.
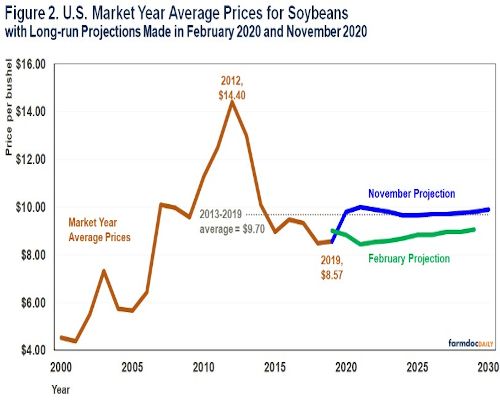
The November forecast projects much higher soybean prices. For 2020 to 2029, November forecasts are, on average, $1.00 per bushel higher than the February forecast. November projections are $9.80 for 2020 and $10.00 for 2021. Then MYA soybean price projections vary from $9.65 to $9.90 from 2022 to 2030. The November forecasts have an average yearly price of $9.79, $.09 higher than the 2013-2019 average.
Overall, a rebound in exports in 2020 and a continuation of export demand growth leads to a more optimistic price scenario for soybeans. The November projection arrives at prices near the 2013-2019 average of $9.80.
Wheat Prices
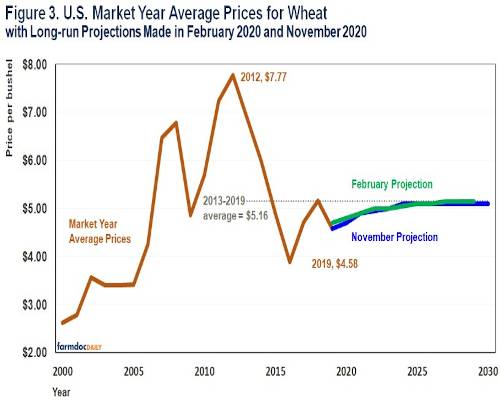
From 2013 to 2019, wheat prices averaged $5.16 (see Figure 3). In the February forecast, 2020 MYA prices were projected at $4.80 per bushel, rising to $5.15 per bushel in 2021 and the remaining years. November projections generally were slightly lower than February projections. The November projection had prices at $3.80 for 2020, rising to $5.10 for 2014 to 2030.
Soybean-to-Corn Price Ratios
Compared to February projections, November projections increased soybean prices relative to corn prices (see Figure 4). The relationship is quantified by the soybean-to-corn price ratio, which equals the soybean price divided by the corn price. Higher values mean soybean prices have increased more than corn prices, indicating that soybean profitability has increased relatively to corn profitability. Conversely, lower values mean soybean prices have decreased relative to corn prices, and soybean profitability has decreased relative to corn profitability.
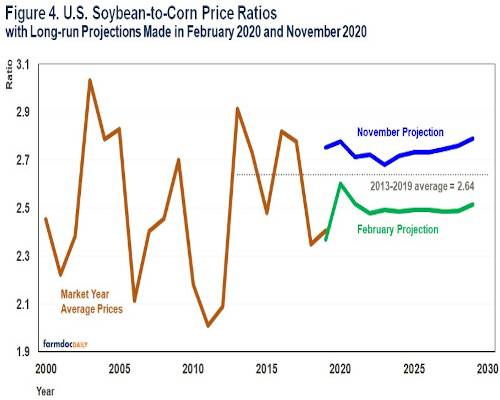
From 2013 to 2019, the soybean-to-corn price ratio averaged 2.64. February projections averaged 2.49, indicating that February projections suggested corn would be relatively more profitable than soybeans when compared to the 2013-2019 period. The November projections have an average soybean-to-corn price ratio of 2.74, above the 2013-2019 average of 2.64. November projections suggest that soybeans will be relatively more profitable than corn in the future when compared to the 2013-2019 period.
Acreage Estimates
Given the increase in relative soybean prices, one would expect an acreage response (see Figure 5). November projections have U.S. soybean acres between 90 and 90.5 million acres for 2021 to 2030, up by an average of 4.5 million acres from February projections.
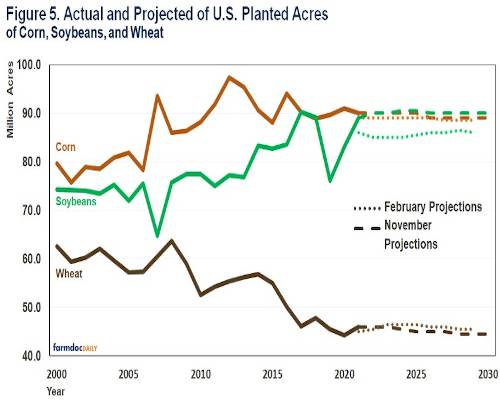
Corn acres also increased in November projections. In November projections, planted corn averaged 89.5 million acres. The February projections average just over 0.5 million acres less than the November projections.
November forecasts indicate soybean acres will exceed corn acres. Planted acres of soybeans have only exceeded corn acres in 2018. An extended period of more soybean acres than corn acres would be a new experience for U.S. agriculture. This may be viewed as a watershed event as demand for crops continues to evolve.
Commentary
November projections place long-run planning prices at $3.55 per bushel for corn, $9.80 per bushel for soybeans, and $5.10 per bushel for wheat. Those prices are considerably more optimistic than our projections made at the beginning of COVID-19 control measures . The corn and soybean long-run prices are slightly below the 2013-2019 averages, and soybean prices are slightly above the 2013-2019 average. USDA projections largely reflect a return to a 2013-2019 normal. This forecast may be based on COVID-19 having limited impacts on demand, particularly ethanol, and continued growing demand for exports. This scenario could be realistic, but more adverse outcomes also are possible. If doing long-run budgeting exercises, the $3.55 corn, $9.80 soybean, and $5.10 wheat prices are reasonable to use. We also suggest using prices of $3.40 for corn, $9.00 for soybeans, and $4.60 for wheat as a set of lower prices that could realistically happen.
Again, note that these long-run planning prices are near 2013-2019 averages. Much of this period has been associated with low incomes relative to 2006-2012 incomes. Moreover, ad hoc Federal payments in the form of Market Facilitation Program (MFP) and Coronavirus Food Assistance Program (CFAP) payments have been important revenue sources. Not continuing these programs at the long-run prices would signal a continued period of low incomes in agriculture.
Recent price changes again place acreage decisions in focus. Long-run forecasts would result in soybeans having a profitability advantage over corn. Soybeans have been more profitable than corn since 2013 in central Illinois . Central Illinois has a comparative advantage in producing corn over other regions, suggesting that soybeans have been more profitable than corn over large areas of the Corn Belt. November price projections suggest that soybeans will continue to be more profitable than corn. It seems possible that different acreage shifts could result, thereby causing soybean-to-corn price ratios to move lower from November projections. Management practices that allow more soybeans in rotations should be evaluated.
Source : illinois.edu