By Scott Irwin
Department of Agricultural and Consumer Economics
University of Illinois
The USDA released final estimates of yield, acreage, and production for the 2020 corn crop on January 12th in its Crop Production Annual Summary report. The final estimate of yield was only 172 bushels per acre, which was a substantial drop from the previous November estimate of 175.8 yields per acre. While there certainly were some late season factors that reduced yield, namely the August 10th derecho and August dryness, the magnitude of the drop was a big surprise to the market. Corn futures prices jumped nearly 30 cents after the USDA report was released on January 12th, and the drop in the corn yield estimate was a major reason. The purpose of this article is investigate whether the final USDA corn yield estimate was an outlier.
Analysis
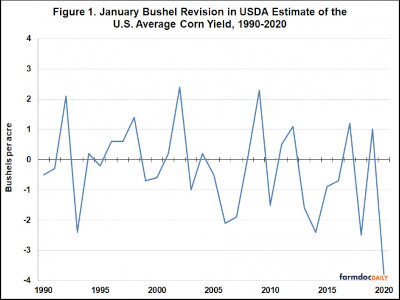
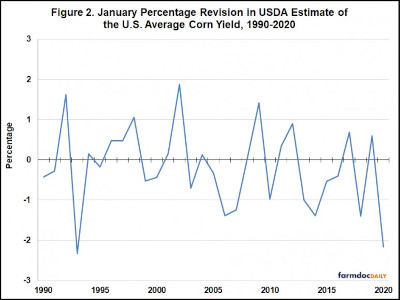
We begin the analysis with Figure 1, which shows the January revision to the U.S. average corn yield for the 1990 through 2020 crops. The revision is computed as the January estimate minus the November estimate in terms of bushels per acre. This figure indicates that the 3.8 bushel drop in the January estimate was indeed very large by historical standards. It is easily the largest revision in absolute magnitude of the last 30 years. It is unusual for downward January revisions to be more than two bushels, whereas the 2020 revision was almost twice as large. One can make a reasonable argument that bushel revisions overstate the size of the 2020 revision since average yields have increased so much over this period. Figure 2 shows the revisions computed as a percentage of the November estimate. The 2020 revision still stands out even in relative terms. There is only one comparable year: 1993 was actually slightly larger in percentage terms. It is interesting that 1993 and 2020 are years with major weather anomalies (floods in 1993 and derecho in 2020).
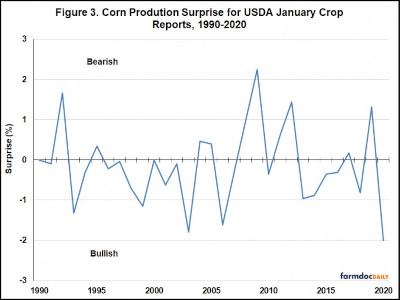
It is clear that the downward revision in the U.S. average corn yield estimate in January was very large by the USDA’s own historical standards. The next step in the analysis is to examine just how big a surprise this was to the corn market. Figure 3 presents the surprise component of USDA final estimates of corn production over 1990 through 2020. Note that production surprises are presented rather than yield surprises, as this is the data we had available for analysis. The production surprise encompasses both yield and acreage surprises so it is not a perfect measure of the yield surprise. The figure shows that the magnitude of the surprise associated with the final production estimate for 2020 was the largest bullish surprise of the last 30 years and the second largest for both bullish and bearish surprises. This confirms that the downward revision in the 2020 revision to corn yield was indeed a very major surprise to the market.
We now turn to analysis of the level of the final 2020 corn yield estimate. In short, was this estimate somehow an outlier? In order to answer this question we need a benchmark for comparison. One possibility is to use estimates from a crop weather regression model as a benchmark, such as the models found in earlier farmdoc daily articles (e.g., July 2, 2020; July 16, 2020). One problem in using crop weather models is the confounding effect of the August 10th derecho. Since the wind damage from the derecho is not measured by the temperature and precipitation variables used as inputs to these models, the forecasts from the models may be inaccurate for 2020.
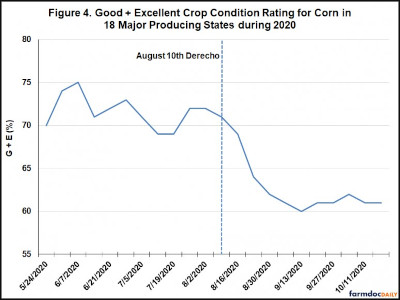
Another possibility is to use simple models based on crop condition ratings, as in previous farmdoc daily articles (e.g., May 24, 2017; November 1, 2017). At least in theory, crop condition ratings should reflect all factors impacting crop production potential, including temperature, precipitation, and unusual wind events like the derecho. This makes crop condition models a better choice as a benchmark in years with an unusual event, like 2020. Figure 4 shows the evolution of the sum of good and excellent weekly crop condition ratings for corn over May 24, 2020 through October 18, 2020 (all available ratings). It is clear that the derecho had an impact on conditions, as they fell from 71 just before this event to a low of 60 in mid-September. The decline in ratings was certainly also influenced by the dry late season conditions in large swaths of the Corn Belt. The exact influence of each of these factors is not a concern for the present analysis, but rather the fact that the ratings reflect both the derecho and the dryness.
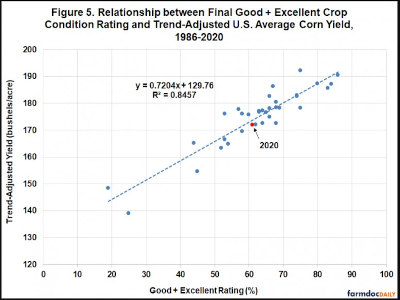
We next update our simple model to forecast the U.S. average yield of corn using crop condition ratings. The modelling consists of first detrending corn yields over 1986-2020 and then regressing detrended corn yields on the sum of end-of-season good and excellent condition ratings. We use end-of-season ratings for this step in because uncertainty about growing conditions has been largely resolved by this point in time. The sample starts in 1986 because this is the first year that national average crop condition ratings were made available by the USDA. Figure 5 contains the results of the regression estimation and they are almost identical to earlier results over 1986-2016 (farmdoc daily, November 1, 2017). What is most interesting for the present purposes is how close the 2020 observation is to the estimated regression line. Specifically, the final USDA estimate of 172 bushels per acre is only 1.7 bushels below the yield predicted by the crop condition model. In this sense, the final USDA estimate is very much in line with final crop condition ratings and does not at all have the appearance of an outlier.
If the final 2020 USDA estimate of corn yield was not out of line relative to crop condition ratings, then why was the January revision so large? In other words, why was such a large revision necessary when crop condition ratings in September were already signaling a yield in the low 170s? Some perspective is provided by Figure 6, which compares crop condition model forecasts to USDA forecasts of corn yield over May 24, 2020 through October 18, 2020. The USDA forecasts for May through July are non-survey based and provided by the World Agricultural Outlook Board (WAOB), while the August through October forecasts are survey-based and provided by the National Agricultural Statistics Service (NASS). The crop condition model forecasts were based on a slightly different model than what is found in Figure 5. Here, detrended yields and end-of-season condition ratings over 1986-2019 are used to estimate the forecast regression model. The coefficients from this model are then used to forecast for each week during 2020. We do this so that 2020 crop condition forecasts are truly out-of-sample, and hence, provide an apples-to-apples comparison to USDA forecasts.
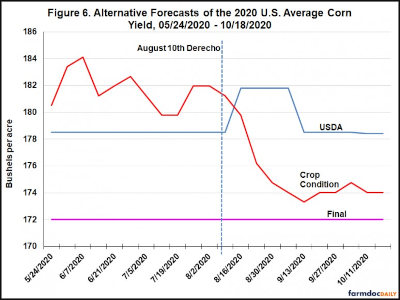
It is interesting to observe the similarity of early August forecasts of corn yield for the crop conditions model and the USDA. On August 9, the crop condition forecast was 181.2 bushels per acre. The USDA released its first survey-based estimate on August 12th, too late to make adjustments for the derecho two days earlier. The August forecast of 181.8 bushels per acre was very close to the crop condition model forecast. But then the evolution of the forecasts during September and October diverged rather sharply. The crop condition forecast dropped step-for-step with ratings, reaching a low of 173.3 bushels per acre on September 13th, before increasing to 174 bushels as a final forecast. Over the same time period, the USDA forecast only declined to 178.5 bushels in September and 178.4 bushels in October. In retrospect, the crop condition model reflected the derecho damage and dryness more quickly and more accurately than USDA forecasts.
Implications
The USDA’s final corn yield estimate for 2020 of 172 bushels was quite a surprise to the market, one of the biggest of the last 30 years. It was also the biggest January revision in bushel terms since 1990. So, it is no surprise that the market was so surprised by the revision. The analysis here shows, however, that the final USDA yield estimate for corn was quite close to that predicted by a very simple crop condition regression model. Using this benchmark, the USDA’s final yield estimate is nowhere near what one might consider an outlier. The real puzzle is why the USDA corn yield forecasts for 2020 stayed as high as they did for as long as they did. After all, crop condition ratings were clearly signaling a crop in the low 170s as early as mid-September, while USDA forecasts remained above 178 bushels per acre. Several explanations are possible. First, the high USDA forecasts may simply be due to random sampling errors that are part of the survey process. But it would take some large sampling errors to account for misses of this magnitude. Second, the traditional farm operator and objective yield surveys may have trouble dealing with one-time unusual events like the derecho. We note that something similar appeared to happen in 1993 after historic floods. Third, the USDA has recently adopted a third satellite-based yield indicator and it may have contributed to the upward bias. The behavior of this indicator is not well understood outside of the USDA. Regardless of the reasons for the post-derecho misses, it is important to remember that the USDA did appear to get it right in the end.
Source : illinois.edu