By Bruce Sherrick
The purpose of this farmdoc daily post is to evaluate the market’s current implied price distribution for fall-time corn and soybean prices, and assess the implication for possible levels of crop revenue.
RMA establishes Projected Prices (PP) each year at the end of February for crop insurance contracts that serve as minimum indemnification prices for crop insurance contracts. For 2018, the corn PP is $3.96 and the Soybean PP is $10.16. During the crop insurance signup period in March, November Soybean futures prices were somewhat above the PP and the early season expectations were for prices at or above the projected prices; while for corn, the December futures prices were only slightly higher than the projected prices. Since then, however, prospects for very large corn and soybean crops, coupled with uncertainty stemming from the administration’s rhetoric and actions around trade have substantially weighed on futures prices with corn now trading roughly $.20 below Spring PP prices, and November Soybean futures trading at roughly $1.35 below their 2018 projected prices.
Because it is often useful to understand possible price levels in relationship to established floor prices in crop insurance contracts, a visual sense of the process for establishing PPs and the movements in prices since the initiation of the crop insurance period is provided in figures 1 and 2 below.
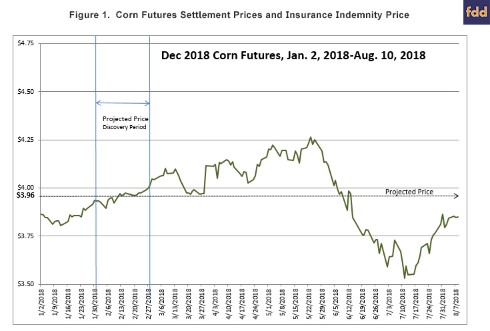
At the beginning of March, it would have been reasonable to conclude that there was about a 50% chance of final corn prices being either above or below $4.00 given the futures prices at that date. As can be seen, prices generally rose throughout the averaging period resulting in an average price of $3.96 which was a few cents below the futures prices in March during signup. The PP is fixed for the life of crop insurance contract and is shown as the horizontal dotted line. After retreating at the end of March, corn prices moved upward during April and most of May before beginning a rather steady two-month decline. There has been a slight recovery in corn since mid-July, but prices remain down about $.20 – or about 5% below the PP with the implication that there is less likelihood for fall prices to be greater than the PP as well.
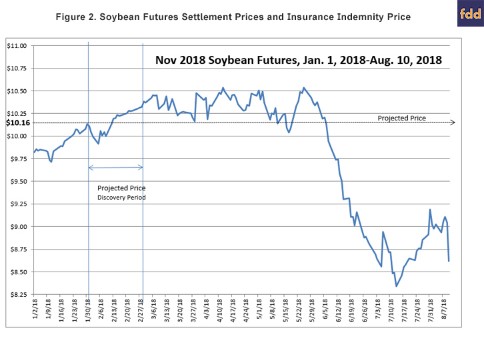
In the case of soybeans, the March prices were briefly above the PP and remained so until early May when they took their first plunge, but recovered and then began their two-month decline at a pace that was proportionally faster than for corn. The November Soybean futures are currently trading at roughly $8.81, off around $1.35 or 13% from the Spring prices. As a result, it is very likely that the $10.16 PP will be the price used in indemnity calculations for Revenue Protection guaranteed revenue in crop insurance contracts this Fall.
Assessing the Likelihood for Future Price Movements
In addition to providing information about future price levels, options markets provide information that allows us to recover a measure of the remaining price risk, or the likelihood for prices to change by any given amount prior to expiration of the contracts shown. To recover probabilistic information from options markets, a technique is used that identifies a best fitting distribution given observed prices of both puts and calls across the set of actively traded strike prices. The specific approach used is somewhat akin to using a variant of the Black-Scholes option pricing model, but solving it “backwards” across all options simultaneously. To make this information readily available, a Price Evaluation Tool is available at the farmdoc Crop Insurance site that allows a user to select an underlying futures contract and the tool returns probabilistic price for prices for the remainder of the contract life. The tool is accessible at: http://farmdoc.illinois.edu/cropins/price-distribution.html
To understand the information provided, a couple of cases are taken from the site and used in a few examples to understand the implications for future crop revenue. First consider the December 2018 Corn contract shown in figure 3 below taken from the site on August 14, 2018 (importantly, these update continuously to reflect market information at the time the site is accessed so results will differ in future as prices change).
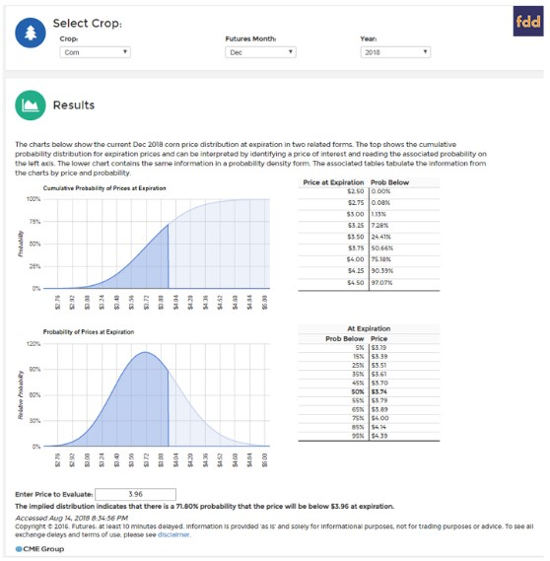
The top portion of the results shows the cumulative probability distribution for prices at the expiration and can be interpreted by reading the probability on the (left) vertical axis of any price of interest on the (bottom) horizontal axis. In the lower panel, the more commonly depicted bell-shaped curve of probability is provided. In the case shown, a price to evaluate of $3.96 was chosen to correspond to the crop insurance projected price, with the corresponding regions shaded in the graphic. In the case shown, current market prices indicate that there is about 72% chance that the expiration price for the Dec 2018 Corn futures will be below $3.96 – in other words, there is only a 28% chance that harvest price will be above the established floor crop insurance price. The tables to the right of the graphics provide identical information in two alternative layouts. In the top table, various possible expiration prices are shown on the left and the associated probability of prices below that level at expiration given on the right. For example, the tool indicates that the is about a 24% chance that futures prices will be below $3.50 at expiration, and that there is currently only about a 10% chance that prices will be above $4.25 (or 100%-90% shown at $4.25). In the lower table, it can be seen that there is about a 50% chance that expiration prices will be below $3.74 according to the option’s market prices, and a 95% chance that prices will be below $4.39. An implication of the price distribution is that it is unlikely that corn crop insurance contracts will have HPs that exceed PPs.
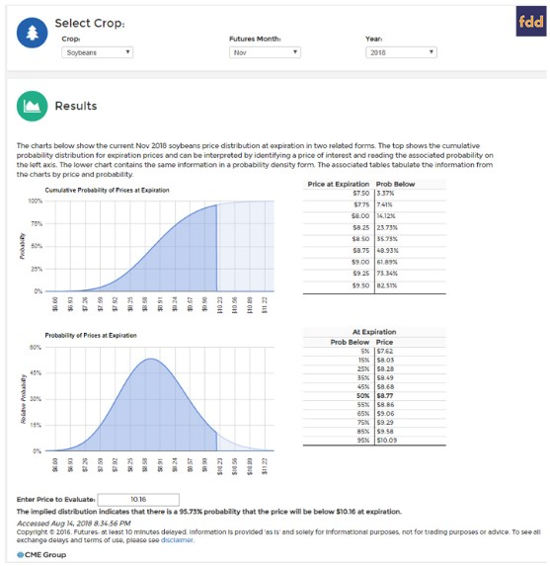
In the case of Nov. 2018 Soybeans shown above, there is currently about a 96% probability that expiration prices will be below the established PP of $10.16 (users can enter any value of interest in the box near the bottom to return the associated probability). The tables on the right again provide a few other specific examples corresponding to the information in the graphs. For example, there is a 50% chance that soybean prices will be $8.77 or less at expiration. An obvious implication of the current price distribution is that the guaranteed revenue under crop insurance has likely increased substantially. As an example, if a producer had an APH of 60 bushels/acre and purchased 85% coverage, the initial guaranteed revenue would have been $518.16 (.85*60*10.16). Under current prices of around $8.81, yields below 58.81 bushels/acre would begin to trigger crop insurance payments. In other words, because prices are off almost 15%, yields that are just slightly below trend would begin to trigger payments for 85% coverage products if price remained at these levels.
As the growing season continues and as uncertainty is further resolved about final production, trade issues, and demand, the prices will continue to shift and evolve and settle on final values. For soybeans, the market’s implied likelihood for a rally sufficient to exceed PP is becoming highly unlikely and thus the effective price for crop insurance indemnities is very likely to be $10.16. The iFARM Price Probability tool provides a simple presentation of the market’s estimated prices and their associated probabilities in an easily understood and easily updated form – even if the information is not what producers hope, it remains important for accurate revenue risk management.
Bruce J. Sherrick, Ph.D., Marjorie and Jerry Fruin Professor of Farmland Economics and Director, TIAA Center for Farmland Research, University of Illinois. Futures data were conveniently accessed through the API at ag-analytics.org (J.D. Woodard, open source, open data platform for agricultural & environmental finance, insurance, and risk), options data provided by Barchart.com. Primary programming support provided by National Center for Supercomputing. All calculation errors are the responsibility of the author.
Note: The views expressed herein are solely the author’s opinions and do not necessarily reflect those of others or entities with whom professionally affiliated. All errors and omissions are the author’s alone.