By Carl Zulauf
Department of Agricultural, Environmental and Development Economics
Ohio State University
Gary Schnitkey and Nick Paulson et.al
Department of Agricultural and Consumer Economics
University of Illinois
This article contains a summary of the US Department of Agriculture (USDA), Farm Service Agency (FSA) report on commodity program choice for the 2021 crop year. For most crops, share of base acres enrolled in ARC-CO (Agriculture Risk Coverage – County version) increased. Share decreased in ARC-IC (ARC farm version) and PLC (Price Loss Coverage). The shift to ARC-CO reflects the increase in program crop prices, which reduced the value of the reference price as a floor on per unit value. ARC-IC enrollment returned to its 2014 Farm Bill level, implying the increase in ARC-IC enrollment during the 2019 and 2020 crop years was not a permanent shift to ARC-IC as the preferred long term program option. Instead, it was likely a temporary increase caused by more than normal prevent plant in the spring of 2019 that guaranteed a payment by ARC-IC for the 2019 crop year.
Program Options
Farmers and landowners can select across three programs:
- ARC-CO makes payments if market revenue for a county is below the county’s benchmark revenue determined in part by historical county yields and US prices.
- ARC-IC makes payments if average actual revenue/acre of all covered commodities planted on the ARC-IC farm is below the ARC-IC farm’s benchmark revenue determined in part by historical farm yields and US prices.
- PLC makes payments if US market year price is below a statutorily determined reference price.
Data
With one exception, the data in this article are from USDA, FSA’s report on 2021 ARC/PLC enrollment. The exception is monthly cash prices of program crops for October 2020 through January 2021. They are from QuickStats maintained by USDA, National Agricultural Statistics Service (NASS).
Enrollment by Program
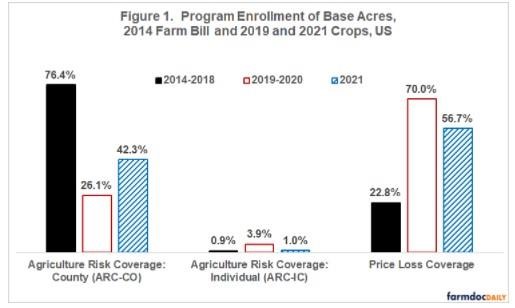
Enrollment decisions for the 2021 crop year resulted in more base acres in ARC-CO and fewer in PLC and ARC-IC than the last program decision which covered the 2019 and 2020 crop years (see Figure 1). Both the 2019-2020 and 2021 enrollment decisions occurred under the 2018 Farm Bill. Enrollment in PLC (ARC-CO) remains substantially above (below) its level during the 2014 Farm Bill for which a single decision applied to the 2014-2018 crop years. Enrollment in ARC-IC is similar. Lack of sustained higher enrollment in ARC-IC suggests the 2019-2020 enrollment increase was not a permanent shift in program preference to ARC-IC but was due to temporary factors, in particular more than normal prevent plant that guaranteed a payment by ARC-IC (see farmdoc daily articles of October 29, 2019 (Zulauf, et al.) and November 23, 2020 (Swanson, et al.)).
PLC Enrollment by Crop
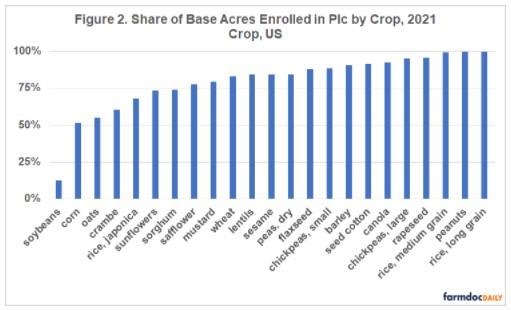
Of the 23 program crops, 16 had more than 75% of their base acres enrolled in PLC for the 2021 crop year. PLC share rounded to 100% for peanuts and long grain rice while exceeding 99% for medium grain rice. Soybeans, at 13%, was the only crop with less than 50% of its base acres enrolled in PLC for 2021. Second lowest enrollment in PLC was corn at 51%.
Change in ARC-CO Enrollment by Crop
ARC-CO enrollment increased for 21 of 23 program crops (see Figure 3). Large chickpeas and medium grain rice were the exceptions. Largest increase was 28 percentage points for corn (from 18% in 2019-2020 to 47% in 2021). ARC-CO’s share also increased by 20 or more percentage points for sorghum and crambe.
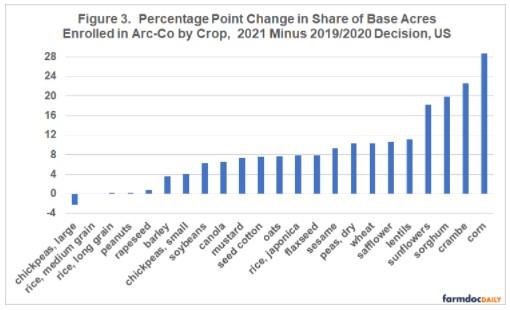
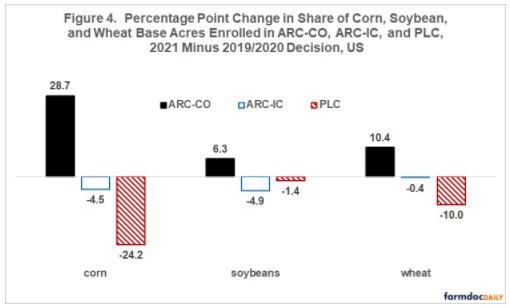
Figure 4 presents a more in-depth look at the 2021 vs. 2019/2020 program decision for corn, soybeans, and wheat, the 3 largest acreage program crops. Corn had the biggest percentage point change in program shares. Soybeans had the smallest change. Percentage point decline in use of ARC-IC was similar for corn and soybeans. This similarity is not surprising since corn and soybeans had similar base acre enrollment in ARC-IC for the 2019/2020 sign up: 5.9% for corn and 6.3% for soybeans. These 2 shares were the highest among the 23 program crops.
Analysis of Change in ARC-CO Share
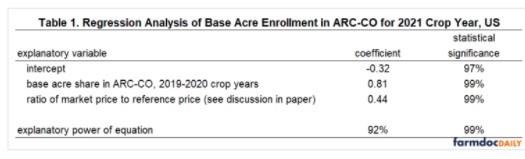
Regression analysis found that 2 factors explained 92% of the variation across program crops in the share of base acres enrolled in ARC-CO: (1) ARC-CO share of base acres in the 2019-2020 sign up and (2) ratio of a crop’s average US market price for October 2020 through January 2021 to the crop’s 2020 effective reference price (see Table 1 and Data Note 1). Both variables were significant with 99% statistical confidence. The first variable reflects historical momentum of program decisions due to familiarity with a program and its historical performance, among other factors. The second variable reflects the 2020 crop year market situation during the time window 2021 program decisions were made. Ratio of market to effective reference price is a measure of the likelihood PLC will make payments, assuming market conditions do not change materially between sign up and the next crop year. Stated alternatively, the ratio is a measure of the value of having the reference price as a floor on per unit value.
Assessment
Share of base acres enrolled in ARC-CO was higher for 19 of 23 program crops in the 2021 sign up.
Higher ARC-CO enrollment reflects the wide-spread increase in prices of the program commodities, which reduced the value of the reference price as a floor on per unit value.
Enrollment in ARC-IC returned to its 2014 Farm Bill level. The increase in ARC-IC enrollment in the 2019-2020 sign up thus was a temporary increase. The likely cause was a greater than normal amount of prevent plant in 2019 that occurred before the 2019-2020 enrollment period ended. Prevent plant guaranteed that ARC-IC would make a payment. There appears to be no shift to ARC-IC as the preferred, long term program choice.
Commodity program enrollment became an annual decision with the 2021 enrollment in contrast to the historical one time sign up for the entire farm bill period. The annualization of program choice will likely increase the importance of contemporary market conditions when making program decisions.
Data Note
The regression analysis involved 17 program crops. USDA, NASS does not report monthly cash prices for crambe, mustard, rapeseed, medium-short grain rice, safflower, and sesame.
Source : illinois.edu