By Gary Schnitkey and Krista Swanson et.al
Department of Agricultural and Consumer Economics
University of Illinois
Carl Zulauf
Department of Agricultural, Environmental and Development Economics
Ohio State University
Returns for share rent, cash rent, and variable cash rent arrangements are estimated for corn and soybeans on high-productivity farmland in central Illinois. Overall, both landowner and farmer returns will be above average if prices continue near current forecast levels and yields are at expected trend levels. Lower revenues can result in farmer losses, even with a crop insurance purchase at the highest coverage level, particularly for cash rent and variable cash rent arrangements. Because of much higher non-land costs in 2022, typical rent factors (32% for corn and 43% for soybeans) cause variable cash rents to have lower returns than both share rent and cash rent arrangements at expected crop revenues for this year. Higher non-land costs suggesting that rent factors on variable leases may need adjustment.
Corn Returns
Returns from alternative rental relationships are illustrated first for corn in this section and then for soybeans in a following subsection. Yields and costs come from crop budgets highlighted in a December 7, 2021, farmdoc daily article. Estimates are for high-productivity farmland in central Illinois.
Corn has an expected yield of 220 bushels per acre. Non-land costs total $755 per acre, with $512 of those being direct costs (fertilizer, seed, pesticides, drying, storage, and crop insurance). Direct costs are shared between farmers and landowners under a typical share rent arrangement.
Projected prices used to set crop insurance guarantees will not be finalized until the end of February. Currently, a reasonable estimate of the projected price for corn is $5.70 per bushel (see farmdoc daily, February 1, 2022). Projected prices are based on futures prices, and cash prices typically are lower than futures prices. A $.30 basis gives an estimated cash price of $5.40 per bushel.
Table 1 shows estimated returns for differing crop revenues by changing the harvest price. Lower prices cause lower crop revenue. All returns in Table 1 are estimated at the expected yield of 220 bushels per acre. Crop revenues could also be influenced by changes in yield with the same impact on returns.
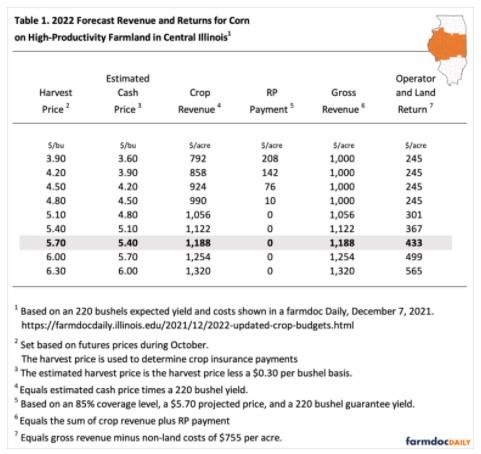
Revenue Protection (RP) proceeds are included in forecasts under lower crop revenues. RP with an 85% coverage level is used as it is the most common insurance type and coverage level used in Illinois (see farmdoc daily, November 17, 2020). For Table 1, RP’s guarantee is based on a projected price is $5.70 and a guarantee yield of 220 bushels per acre. For the prices scenarios shown in Table 1, RP at the 85% coverage level makes payments at harvest prices below $4.80. At lower prices, RP payments offset declines in crop revenue, and the minimum gross revenue is $1,000 per acre.
Over time, harvest prices average the projected price, and a good, expected return would be the $5.70 projected price. At a $5.70 harvest price, operator and land return is $433 per acre (see shaded line of Table 1). A $433 operator and land return is $102 per acre higher than the $331 average return from 2000 to 2020. This $433 per acre will be split between the farmer and landowner, with the lease type influencing how the return is shared between the farmer and landowner.
Table 1 shows the range of returns possible given the yield and cost assumptions used, with the lowest operator and land return, to be divided between the farmer and landowner, at $245 per acre. However, there are situations in which lower operator and land returns could occur then those shown in Table 1 despite the excellent downside protection provided by RP crop insurance. Scenarios include:
- Non-land costs are higher than $755 per acre. For example, pest issues could require “rescue” spays, which would increase costs.
- Basis could be more than $.30 per bushel.
- Values in Table 1 assume that corn is sold at harvest. Farmers could choose to hold grain unpriced, thereby speculating on higher returns and receiving a lower price after harvest. Of course, prices could also rise between harvest and the time grain is sold, leading to higher incomes.
Leasing Returns for Corn
Table 2 shows land and owner shares of operator and land returns under three leases.
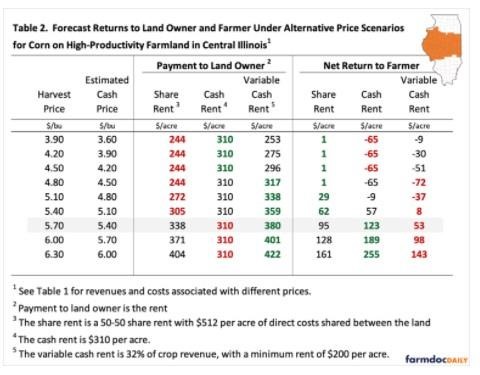
Share Rent: For central Illinois, a typical split is 50% and 50%, in which the landowner and farmer share equally in gross revenue and direct costs. This 50%-50% lease is used in Table 2. Landowner returns in Table 2 include RP-85% payments, meaning that the landowner purchased crop insurance on their share. If this were not the case, payments to the landowner would be reduced by 50% of the RP-85% payments shown in Table 1.
At a $5.70 harvest price, the share rent has a payment to the landowner of $338 per acre (see Table 2). This payment goes down to $244 per acre for a minimum at harvest prices below $4.80 per bushel. Higher prices would result in higher returns.
At a $5.70 harvest price, the farmer has a net return of $95 per acre (see shaded line in Table 2). The lowest farmer return is $1 per acre, occurring at harvest prices below $4.80
Cash Rent: The cash rent is $310 per acre, an estimate of the average rent for 2022. The landowner receives $310 per acre no matter the price or yield level. At the $5.70 harvest price, the farmer return is $123 per acre. The lowest farmer return is -$65 per acre.
There are reports of much higher rents for 2022 on some farms:
- A $338 cash rent results in the same return to the farmer and landowner as the share rent at a $5.70 harvest price.
- A $350 cash rent results in an $84 expected return to the farmer at a $5.70 harvest price. The lowest return a farmer can obtain then is -$105 per acre.
- A $400 cash rent results in a $33 per acre return to the farmer at a $5.70 harvest price. The lowest return is -$160 per acre.
Variable Cash Rent: The variable cash rent shown in Table 2 is based on parameters including the variable rent factor explained in a farmdoc Daily article entitled “A Straight-Forward Structure for a Variable Cash Rent” (farmdoc daily, August 10, 2021).
This lease has a minimum cash rent of $200 per acre and a rent factor of 32% for corn. Under this lease, the landowner receives rent equal to 32% of crop revenue. At a $5.70 harvest price, the landowner would receive $380 per acre, and the farmer’s return will be $53 per acre.
A 32% rent factor results in a $380 payment to the landowner at a $5.70 harvest price. The farmer would have a return of $53 per acre at that price level.
Rent payments to the landowner go down with lower crop revenues. Farmer losses reach a maximum of -$72 per acre, at a revenue just before the 85% RP policy begins to make payments.
Over the years from 2000 to 2020, a rent factor of 32% resulted in the same payment under a cash lease as under a variable share lease. At the $5.70 expected level, the rent factor would need to be 26% for the landowner payment under the variable lease to equal the cash rent. Much higher cost levels have occurred in 2022. These higher costs require a downward adjustment in rent factors if the variable cash lease will have the same return as the cash rent at the expected return level.
Reports are that some variable leases have much higher rent factors. At a $5.70 harvest price, a rent factor of 40% results in a $475 payment to the landowner, and -$42 return to the farmer. Again, this points to the need to lower rent factors given higher costs.
Soybeans Returns
Forecast returns for soybeans grown on high-productivity farmland in central Illinois are shown in Table 3. Current futures prices suggest a projected price of $13.80 per bushel. Non-land costs are estimated at $476 per acre (see farmdoc daily, February 1, 2022).
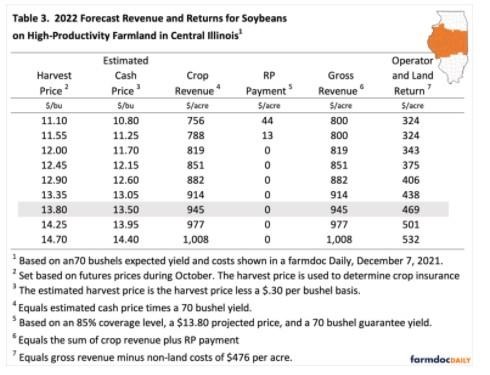
At a $13.80 harvest price — the expected level given a $13.80 projected price — soybean gross revenue equals $945 per acre, and operator and land return equals $469 per acre. A $469 return is $144 above the $322 per acre average from 2000 to 2020. Given an 85% RP purchase, the lowest gross revenue is $800 per acre, and the lowest operator and land return is $324 per acre. The same caveats of minimum returns given for corn apply to soybeans.
Share rent: Share rent returns to the landowner are projected at $338 per acre for a harvest price of $13.80 per acre (see Table 4). The farmer has a return of $132 per acre at that price. The lowest payment to the landowner is $265 per acre, which leaves a $59 net return for the farmer.
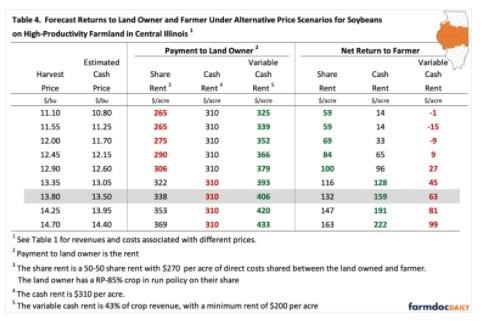
Cash Rent: An average cash rent leaves a $132 per acre return to the farmer at a $13.80 harvest price. The lowest return to the farmer under a share rent is $59 per acre.
Variable Cash Rent: The variable cash lease is assumed to have a rent factor of 43%, again the level that causes rents from the variable lease to equal that from a cash rent from 2000-2020 (farmdoc daily, August 10, 2021). At a $13.80 harvest price, the variable cash rent has a payment to the landowner of $406 per acre, and a return to the farmer of $63 per acre.
The rent factor would have to be lowered to 33% for the variable cash rent and cash rent arrangements to have the same payment to the farmers and landowners in 2022, a change from the historical average given the significant increase in non-land costs.
Commentary
Several points can be made from the above example:
- If prices continue at their current levels and yields are at or above trend levels, farmers and landowners will have profitable years. Declines in returns will have negative impacts on farmers and, in the case of share and variable cash lease arrangements, on the landowners. For a $310 cash rent, farmer returns can be negative for corn and low for soybeans if crop revenue declines. Higher cash rents would make farmer losses larger.
- Rent factors shown above were calculated in 2021 at rates that would cause cash rents and variable cash rents to have the same returns average over time based on the previous two decades. Those rent factors cause lower returns to farmers than the other rent types this year. Much of the reason for this decline is the higher non-land costs in 2022. If any adjustments are made to rent factors, the higher non-land costs would suggest lowering rent factors.
Source : illinois.edu