By Gregg Ibendahl
Introduction
On May 12, 2023, the National Agricultural Statistics Service (NASS), released their May estimate of winter wheat crop production. NASS is forecasting U.S. production of 1.13 billion bushels which is up 2 percent from last year. With a forecast harvested acres of 25.3 million, the average yield would be 44.7 bushels per acre.
NASS uses survey data to provide a May 1 estimate on a state-by-state basis of both expected yields and harvested acres. One limitation of the NASS data is that only point estimates are provided of yields and harvested acres. Another limitation is that the crop production reports are only monthly and may not reflect the current conditions.
The USDA also collect weekly data that can be used to estimate wheat yields and production. These estimates start in April and continue thru harvest. The USDA also does the same estimation for corn and soybeans throughout the summer. The USDA rates the wheat crop in each state as either: very poor, poor, fair, good, or excellent. These estimates are reported on Monday afternoons based on reports collected from the prior weekend. With only a few days between reporting and publication, this data is some of the most current data available from the USDA.
As detailed in Ibendahl (2022), the USDA weekly crop conditions can be used to model both yields and harvested acres. This paper uses a similar procedure to estimate both yields and harvested winter wheat acres for the 18 winter wheat states that have 30 years of weekly wheat crop condition reports. The model presented here uses the May USDA crop report as the basis for wheat acres but estimates yield on the most recent week of crop condition reports. The model presented here provides a confidence interval for acres, yields, and total production.
Procedure
As described earlier in Ibendahl (2022), the Bain and Fortenbery model uses all five of the crop condition values in the construction of an index (CCIndex).
CCIndex = (% acreage Excellent) * 1 +
(% acreage Good) * 0.75 +
(% acreage Fair) * 0.50 +
(% acreage Poor) * 0.25 +
(% acreage Very poor) * 0
Because the crop conditions are mutually exclusive, the sum of the percent of acres across the five categories must total to 100 percent. Thus, possible index values range from 100 (if all the crop acres are excellent) down to 0 (if all the crop acres are very poor). A value of 50 would indicate the average crop condition for the state is in fair condition. The USDA provides data at the state level but not at the crop reporting district level nor at the county level. This last distinction could be important as in some states like Kansas, there is a wide variation in wheat quality from county to county.
In this analysis, the crop condition report for a specific week is used to construct a CCI index for the last 30 years. The crop conditions from the week of May 21 are used in the model reported here. These CCIndexes are then used in a regression analysis to estimate the deviation from trend line wheat yield in each state. Each state is estimated individually and the yield per acre confidence interval for each state is also calculated. Because the yield estimate is based on a specific week, the model must be rerun for each week of the growing season. That is, an analysis of the crop growing conditions next week will produce a different set of parameters than the current week as the CCIndex changes from week to week for both the current and historical years.
To estimate wheat production in each state, an estimate is needed of the harvested acres as well. In this analysis, the harvested acres estimate is based on a regression analysis of the May crop report number, the percent of wheat in the very poor category for the given week, and the percent of the May crop report acres relative to the planted acres. Because the May crop report number is a good guide to final harvested acres, this estimate has a strong fit compared to the estimation of yield. This acre estimate is also based on the last 30 years of data.
Results
Table 1 shows the estimated yield per harvested acre prediction along with the confidence intervals for each state as of the crop conditions on 5/21/23. Wheat can be a difficult crop to forecast yields as wheat yields can often be surprising based on how it looks in the field. In general, soybeans and corn have higher R-squared values (a better fit), at comparable stages of the growing season. Late rains can help with wheat fill in some situations, however, there are counties in Kansas where no amount of rain will add improvement to the yields.
Table 2 shows the estimated harvested acres for each state where the main model factor is the USDA May estimated acres. This part of the model has a very good fit. However, there is some indication that the USDA may be underestimating harvested acres in some states. For example, Kansas, Colorado, and Oklahoma all have modelled acres above the USDA May estimate.
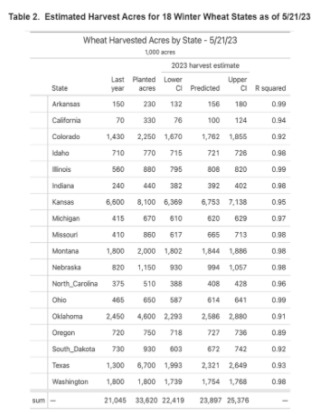
Table 3 shows the estimated winter wheat production for the 18 winter wheat states with long term crop condition data. This estimate is produced by multiplying Table 1 and Table 2 together.
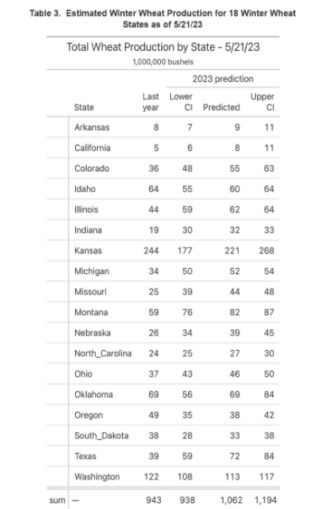
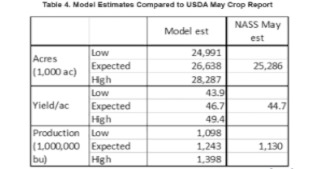
Table 4 takes the 18 winter wheat states used in the model and scales the numbers upward to give a national estimate of yields, harvested acres, and total production. As shown in the table, the model used here estimates 26.6 million harvested acres of winter wheat compared to the USDA estimate of 25.3 million (a 5.3% increase). The estimated yield per acre is also higher at 46.7 bu/ac compared to the USDA estimate of 44.7 bu/ac. Thus, the total winter wheat production is forecast at 1.24 billion bushels compared to the USDA estimate of 1.13 billion bushels (a 10% increase).
Other Points
The USDA estimate is certainly within the confidence interval provided by the model so these two approaches used to estimate winter wheat give comparable estimates. The biggest factor though impacting the national results may be the Kansas wheat production. Kansas has more than double the wheat acres of the next biggest wheat state. Kansas has experienced extreme drought in many of its leading wheat counties so both this model and the USDA survey are based on conditions that have seldom been experienced before. Both the actual yield and harvested acres could turn out to be significantly different than any of the estimates.
Source : illinois.edu