By Scott Irwin and Todd Hubbs
Department of Agricultural and Consumer Economics
University of Illinois
The large size of modern planters obviously implies that a planter today can cover many more acres per day than smaller planters of the past. Based on this observation, it is not unusual for people to argue that it takes fewer days to plant the Corn Belt now than in the past, perhaps as few as five days under ideal conditions. However, our previous analyses (farmdoc daily, April 19, 2018; April 17, 2019) shows this is not borne out by historical data on planting progress for three states in the heart of the U.S. Corn Belt—Illinois, Indiana, and Iowa. We find a striking stability and similarity in the minimum number of days required to plant the corn crop in the three states over 1980-2018. While there is some variation in these estimates over time, producers in Illinois, Indiana, and Iowa need a minimum of about 14 suitable field days, or two weeks, to plant the corn crop based on maximum daily rates of planting progress, and this has changed little since 1980. Essentially, bigger but fewer planters today plant about the same acres per day in aggregate as more numerous but smaller planters did in the past.
We can now add 2019 to our previous sample. This is especially helpful because 2019 serves as an extremely interesting case study for the potential pace of planting the U.S. corn crop. Given the extraordinary wet conditions experienced in much of the Corn Belt last April and May, corn planting was very late. For example, Illinois did not reach 50 percent planting progress for corn until early June, something that had never occurred in the last 60 years. The extremely late start to planting the 2019 corn crop meant that many producers had a very large incentive to plant faster if that was possible. Some have argued that investment in planting equipment during the last decade created extra capacity that simply had not been fully utilized. If this was the case, it should have been apparent in the 2019 data on planting progress. The purpose of today’s article is to update our previous estimate of the minimum number of suitable field days required to plant the U.S. corn crop and determine whether planting in 2019 was unusually fast once conditions improved.
Analysis
We follow the same procedures as in our earlier analyses (farmdoc daily, April 19, 2018; April 17, 2019) and examine planting progress data reported in the USDA’s weekly Crop Progress report for Illinois, Indiana, and Iowa over 1980 through 2019. The sample is extended by one year (2019) compared to our previous work. These three states typically contain about a third of the corn acreage planted in the U.S. and are assumed to be representative of planting rates throughout the Corn Belt. We start by computing the number of acres planted per suitable field day each week that progress data is reported for each state. It is important to measure planting progress per suitable field day since this standardizes for the varying number of days during a week that are suitable for planting. Some weeks may have large reported planting progress but this could be due to an unusually high number of suitable field days rather than a high rate of planting progress per day. Since planting progress is reported as the percentage of total acreage planted, we multiply the percentage progress by total planted acreage of corn for each state in a given year to obtain planting progress in terms of acres. Note that 1994 is excluded for Indiana as we were not able to collect complete data on suitable field days that year. We recognize that the estimates of weekly planting progress and the number of days suitable for field work reflect some judgment on the part of reporters and therefore may not always be completely accurate. In particular, there is some uncertainty about how reporters make adjustments to the base of planted acreage during years like 2019 when there are large amounts of prevent plant acres.
Since we are interested in the minimum number of days that it is possible to plant the U.S. corn crop, we focus on weeks with the highest acreage planted per suitable field day. In other words, we want to know how fast the corn crop can be planted based on the highest rates of planting progress in the historical record. This should be kept in mind when considering the results of the analysis. Whether producers can actually maintain peak week progress for an extended period is uncertain. In addition, we average the progress per suitable field day for the two highest weeks each year in order to smooth out some outliers that appear in the single highest week each year.
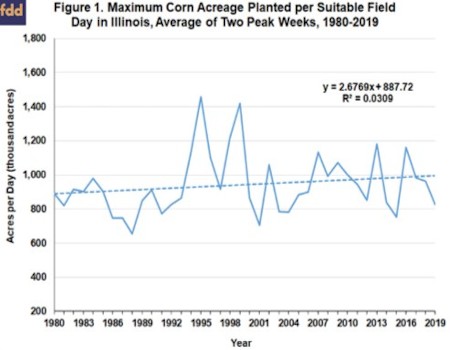
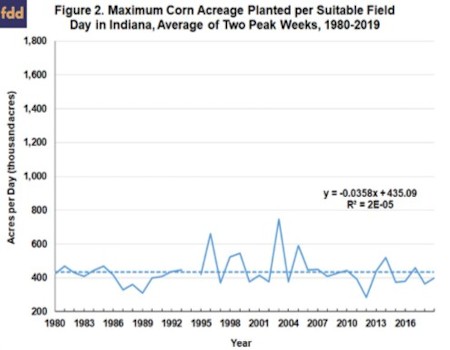
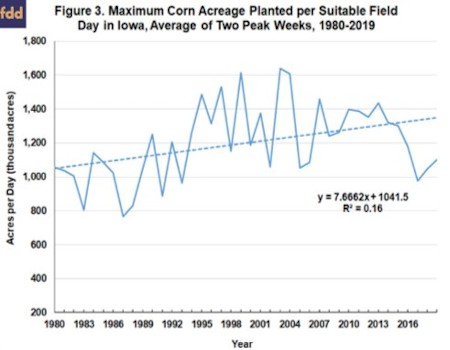
Figures 1-3 present our estimates of the maximum corn acreage planted per suitable field day in Illinois, Indiana, and Iowa, respectively, over 1980-2019. There is no evidence of a pronounced upward trend in the maximums for Illinois and Indiana, with a slight upward trend for Illinois over the sample period, from about 900 thousand acres per day in the early 1980s to about 1 million acres per day towards the end of the sample. In 2019, the maximum per day in Illinois dropped to 825,000 acres, but this was still well within the range of data for the last decade. The maximum rate per day in Indiana showed virtually no trend since 1980, averaging a bit over 400 thousand acres, and this was very close to the rate for 2019. The maximum rate of planting progress in Iowa exhibited a different pattern than the other two states. A pronounced upward trend was evident from 1980-2004, with the maximum rate increasing from around 1 million acres per day to around 1.6 million acres per day, an increase of 60 percent. After 2004, the maximum rate for Iowa leveled off, then dropped precipitously, with some recovery in 2018 and 2019. While the maximum rate for 2019 was higher than in 2018 for Iowa, it was still within the range of historical experience. Overall, the estimates in Figures 1-3 show that maximum planting rates per suitable field day in the heart of the Corn Belt have increased very little over time and did not show historically unusual increases in 2019. This also indicates that investment in planting equipment during the last decade did not create extra capacity that could be called upon when conditions delayed planting substantially.
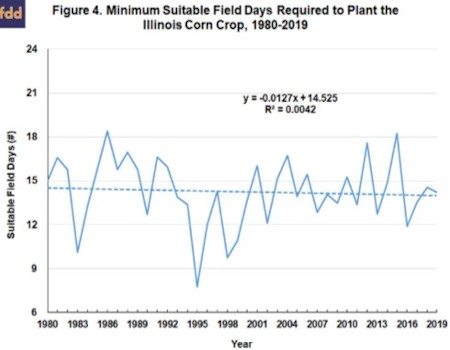
The next step of the analysis is to update our previous estimates of the minimum number of days required to plant the corn crop in each of the three states. We do this by dividing total planted acreage of corn in each state each year by the estimated maximum rate of corn planting progress per suitable field day shown in Figures 1-3. This provides an estimate of how fast the corn crop in the three states could be planted assuming the rate of daily planting is at the maximum. The computation also takes into account the changing total planted acreage of corn in each state over time. Figures 4-6 present the estimated minimums for Illinois, Indiana, and Iowa, respectively, over 1980-2019. One is immediately struck by the stability and similarity of the minimum number of days required to plant the corn crop. There is a slight downtrend in the minimum number of days for Illinois and Indiana, from about 15 days in the early 1980s to about 14 days in recent years. Mirroring the earlier results, the pattern for Iowa is different, with a notable decline through 2004 and a return in recent years to a similar number of days, about 14, as in the early 1980s. The results indicate that it takes about 14 days, or two weeks, to plant the corn crop in each of the three states assuming maximum daily rates of planting progress and this conclusion is not altered by the addition of observations for 2019.
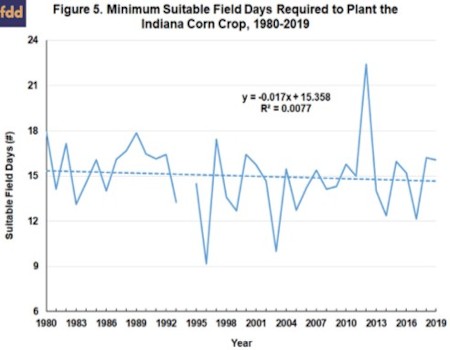
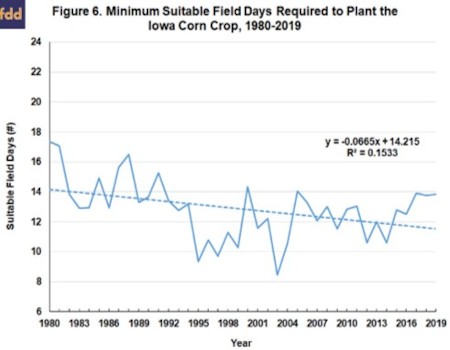
The analysis does not provide any evidence that the 2019 corn crop was planted faster than normal despite the strong incentives to plant quickly. It is interesting to observe that the peak rates of planting progress in 2019 did occur later than usual, especially in Illinois and Indiana where the peaks were in late May and early June. There is also the possibility that peak rates in the eastern Corn Belt in 2019 were limited due to the extraordinarily wet conditions and severely compressed window available for planting. Hence, it is important to continue monitoring data on peak planting rates in the future.
Implications
There is considerable disagreement surrounding the question of the speed that the U.S. corn crop can be planted. Spurred on by the large size of modern planters that can obviously plant many more acres than the smaller planters of the past, it is not uncommon to argue that fewer days are needed today to plant the entire Corn Belt now than in the past. We examine historical data on planting progress for three states in the heart of the U.S. Corn Belt—Illinois, Indiana, and Iowa—and show that maximum planting rates per suitable field day in the heart of the Corn Belt have increased very little over time and were not out of the ordinary in 2019. We continue to find that it takes a minimum of about 14 days, or two weeks, to plant the corn crop in each of the three states and this conclusion is not altered by the addition of observations for 2019. These findings imply that bigger but fewer planters today plant about the same acres per day in aggregate as more numerous but smaller planters did in the past. It is crucial to understand that these findings apply to an aggregate scale such as a state or the entire Corn Belt. There are undoubtedly some individual farm operations that can plant their total corn acreage faster than in the past. But when aggregating across all farm operations on a large scale the data indicate this is not generally the case.
These findings provide an important benchmark for assessing 2020 corn planting progress in the midst of the coronavirus pandemic. At the present time there does not appear to be widespread issues with coronavirus-related slowdowns in the corn planting supply chain. But this can change and if the bulk of the corn crop is not planted after 15-20 suitable field days have accumulated throughout the Corn Belt this would be an indicator that problems have emerged.
Source : illinois.edu