By Carl Zulauf
Department of Agricultural, Environmental and Development Economics
Ohio State University
By Gary Schnitkey and Jonathan Coppess
Department of Agricultural and Consumer Economics
University of Illinois
This article examines payment per base acre by ARC-CO (Agriculture Risk Coverage – County) and PLC (Price Loss Coverage) for covered program commodities harvested in 2014-2018. Variation can be substantial, both across commodities for a given program, especially PLC; and across the 2 programs for a given commodity. The variation by program reflects in part differences in program design, notably deductibles and payment caps. As the US approaches the next farm bill, program design is a looming policy issue. Potential design changes are discussed.
Variation across Commodities by Program
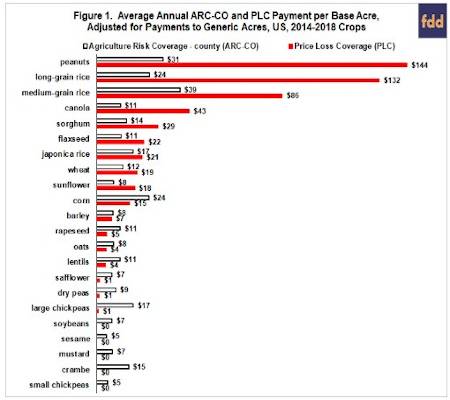
Using USDA, FSA (US Department of Agriculture, Farm Service Agency) data and excluding payments to generic acres (see Data Notes 1 and 2), average payment per base acre enrolled in ARC-CO over the 2014-2018 crops ranged from $39 (medium grain rice) to $5 (sesame, small chickpeas) (see Figure 1). The range for PLC was $144 (peanuts) to $0 (soybeans, sesame, mustard, crambe, small chickpeas). While PLC’s range is much larger, average payment per base acre by the 2 programs is positively related. Fifty-nine percent of the variation in average payment per base acre of a program is explained by the other program. Such explanatory power is relatively high for a single variable. Furthermore, peanuts, long-grain rice, and medium-grain received 3 of the 4 highest payments by both programs.
Program Payment Difference
Average annual PLC minus ARC-CO payment difference ranges from $113 (peanuts) to -$16 per base acre (large chickpeas) (see Figure 2). A negative sign means ACR-CO payment is higher. Numerical difference does not, however, mean a difference is statistically significant. Statistical significance is a more conservative measure because it takes into account the variation of a variable. The more a variable varies the lower is the probability a numerical difference is statistically significant. The variation of interest in this analysis is the year-to-year variation in PLC minus ARC-CO payment difference.
The test used in this analysis is the “t-Test: Paired Two Sample for Means” in Excel. The 2 samples are ARC-CO payment per base acre by year and PLC payment per base acre by year. Test results are reported in Figure 3 as the level of confidence that the 2 payment series differ statistically. PLC payment per base acre is higher for the top 9 covered commodities in Figure 3. They are sorted from highest to lowest confidence. ARC-CO payment is higher for the bottom 13 commodities. They are sorted from lowest to highest confidence. The middle of Figure 3 contains the commodities with the lowest confidence that payment per base acre differs statistically between ARC-CO and PLC. Last, Figure 2 is presented so that the covered commodities are side-by-side in Figures 2 and 3.
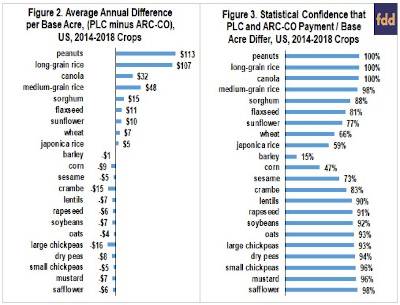
PLC payment per base acre is higher with statistical confidence that rounds to 100% for peanuts, long-grain rice, and canola and to 98% for medium grain rice. ARC-CO payment per base acre is higher with at least 90% statistical confidence for 9 crops: safflower (highest at 98%), mustard, small chickpeas, dry peas, large chickpeas, oats, soybeans, rapeseed, and lentils. Ninety percent is the lowest statistical confidence economists commonly use. ARC-CO and PLC payment per base acre do not differ with 90% statistical confidence for 9 covered commodities, including corn and wheat.
Examining PLC’s Larger Payment Range
PLC’s larger range of payment per base acre is primarily related to 2 program features. First, ARC-CO but not PLC has a deductible on its payment rate. ARC-CO pays if county revenue is less than 86% of a county’s benchmark revenue. PLC pays if US market year price is less than 100% of a reference price. Importance of ARC-CO’s deductible can be illustrated for peanuts. Over the 2014 farm bill, US market year price for peanuts averaged 79% of its reference price. If PLC had a 14% deductible on payment rate like ARC-CO, PLC’s payment rate for peanuts would have averaged approximately 7% (86% – 79%), not 21% (100% – 79%), and PLC payment to peanuts would have averaged close to $50, not $144, per base acre. ARC-CO payments to peanuts averaged $31 per base acre.
PLC’s advantage from no deductible is partly offset by a lower PLC yield. The 2014 Farm Bill allowed farms to update their PLC yield to 90% of average 2008-2012 yield. ARC-CO yield is the Olympic average of the 5 most recent county yields. This yield difference can be notable given the increase in yields over time, but the lower PLC yield only partly offsets the impact of the ARC-CO deductible on payment rate. The reason is that ARC-CO’s deductible applies to its benchmark revenue, and thus applies to both price and yield. Only yield is reduced in calculating PLC’s payment rate.
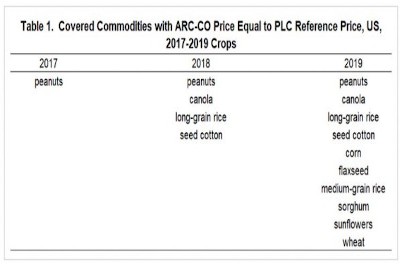
Importance of ARC-CO’s deductible on payment rate has grown as market year prices have continued to trend lower. An advantage of ARC-CO is that can provide assistance when market price is above the reference price and declines. This advantage disappears when market year price is below the reference price. ARC-CO replaces market year price with the reference price when the reference price is higher, a feature that has become increasingly common when calculating the 5-year Olympic average price component of ARC-CO’s benchmark revenue. Covered program commodities for which the reference price is the ARC-CO price component has increased from 1 in 2017 to 10 in 2019 (see Table 1). ARC-CO’s advantage of having a potentially higher price component is diminishing.
The second program difference is ARC-CO’s much tighter cap on program payment rate. ARC-CO’s cap is 10% of county benchmark revenue. PLC’s cap is the difference between a covered commodity’s reference price and US loan rate. For the 2014 farm bill, PLC’s cap averaged 50% for the 22 covered commodities, with a range of 34% (peanuts) to 61% (barley, small chickpeas).
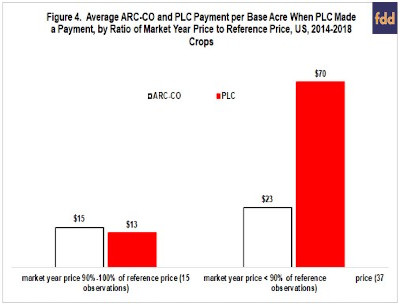
Of 110 market year– covered commodity observations (110 = 5 times 22) during the 2014 Farm Bill, 15 had a market year price between 90% and 100% of the reference price. Average payment per base acre by ARC-CO and PLC was similar for the 15 observations (see Figure 4). For 37 observations, market year price was more than 10% below the reference price. PLC’s payment rate thus exceeded ARC-CO’s 10% cap. ARC-CO’s average payment per base acre was 50% higher for these 37 observations; PLC’s average payment was 438% higher. Ratio of market year to reference price for the 37 observations averaged 81%, implying PLC payment rate was nearly twice ARC-CO’s payment rate cap. Six covered commodities accounted for 27 of the 37 observations: 5 years each for peanuts, long-grain rice, and canola; plus 4 years each for medium-grain rice, flaxseed, and sorghum.
Summary Observations
Before discussing the summary observations, it should be underscored that ARC-CO and PLC payment per base acre is not calculated for the same base acre but for the base acres enrolled in each program. Some of the difference in payment per base acre is likely due to the different attributes of base acres enrolled in each program. This caveat should be kept in mind when interpreting the findings presented in this article.
During the 2014 Farm Bill, variation in payment per base acre across the 22 covered commodities was much larger for PLC than ARC-CO, even though the largest (smallest) payments by both programs tended to be to the same covered commodities.
PLC’s larger range of payments primarily reflects differences in 2 program parameters. ARC-CO has a 14% deductible on its payment rate; PLC has no payment rate deducible. ARC-CO has a 10% cap on its payment rate; PLC’s payment rate cap varies from 34% to 61%; depending on the commodity.
During the 2014 Farm Bill, payments were higher with 90% or more statistical confidence by ARC-CO for 9 covered commodities and by PLC for 4 covered commodities. Statistical confidence was highest (near 100%) for PLC payments to peanuts, long-grain rice, and canola.
Currently PLC is expected to make higher payments per base acre for most covered commodities over the 2018 Farm Bill. Base acres enrolled in PLC rose to 70% in the sign up for 2019 crops vs. 23% in the 2014 Farm Bill sign up. The jump reflects not only the lower prices of recent years but also program features that favor PLC when prices are stable to declining and also below the reference price. These features include PLC’s zero deductible on its payment rate and higher payment cap.
As the US looks to the next farm bill, design differences between ARC-CO and PLC is a looming policy issue. Specifically, are current differences in deductibles and payment caps appropriate for the price regime expected at the time the next farm bill is written? A more equitable balance in program design will allow farms to better match commodity program choice to their profit and risk profile.
One design approach is to reduce program differences via marginal adjustment. Marginal adjustments would not necessarily involve much, if any budget exposure provided they do not massively shift program choice by increasing projected commodity program payments.
A second design approach is to equate expected payment per base acre over the life of the farm bill for both programs for each covered commodity. This approach would reduce political infighting that has marked the last 3 farm bills and clearly allow farms to match program choice to their profit and risk profile. It would almost certainly mean that ARC-CO program parameters would need to vary by covered commodity beyond the current differences in reference prices.
A third design approach is to create a single commodity program that combines features of ARC-CO and PLC. Sign up during the last and current farm bill clearly reveals that farms find features of both programs desirable. Simply selecting one program over the over is not likely to be an acceptable approach because it does not address the underlying differences that led to the creation of 2 programs in the first place.
A fourth design approach is to create a combined commodity program having an ARC-CO and a PLC component. Farms could receive the lower, average, or higher of the 2 payments, with this choice depending on budget constraints. The 2018 Farm Bill took a step in this direction by authorizing an annual sign up, thus allowing farms to receive payments from both programs for a given covered commodity over the life of the farm bill. Historically, farms could sign up for only one program per covered commodity over the life of a farm bill.
Which design approach is taken will depend on many factors, including the willingness of farm policy actors to compromise and probably most importantly the budget constraint under which the new farm bill is written, both for the commodity program title and for the farm bill in total.
Data Notes
- Payment per base acre by ARC-CO (PLC) for a given year was calculated as follows. [(FSA reported payments by ARC-CO (PLC) for the covered commodity minus FSA reported payments by ARC-CO (PLC) for the covered commodity planted on generic acres (see Data Note 2)) divided by base acres of the covered commodity enrolled in ARC-CO (PLC) during 2014 farm bill sign up].
- Cotton was not a covered commodity in the 2014 farm bill, and thus was not eligible for ARC and PLC payments. This decision was driven by Brazil’s successful World Trade Organization suit against US cotton support programs. Congress however converted cotton base acres into generic base acres and made covered commodities planted on them eligible for ARC and PLC payments. Generic base acres existed for the 2014-2017 crops. Congress eliminated them for the 2018 crop because it made cottonseed a covered commodity. ARC-CO and PLC payments to covered commodities planted on generic base acres totaled $1.31 billion for the 2014-2017 crops.
Source : illinois.edu