By Gary Schnitkey and Jim Baltz et.al
Department of Agricultural and Consumer Economics
University of Illinois
Carl Zulauf
Department of Agricultural, Environmental and Development Economics
Ohio State University
The Risk Management Agency (RMA) undertook a rating review that was published in 2011 because of relatively low loss ratios for some crops, including corn and soybeans. Revised ratings began to be implemented in 2012. We examine if crops that had low loss ratios before 2012 continue to have low loss ratios after the review. Five crops with low loss ratios before 2012 are almonds, soybeans, potatoes, rice, and corn. Except for rice, the remaining crops continued to have low loss ratios after 2012. Corn and soybeans continue to have low loss ratios, with soybeans being markedly below other crops.
Loss Ratios
Loss ratios are used to judge crop insurance performance. A loss ratio equals indemnity payments on crop insurance divided by the total premiums paid for crop insurance. Total premiums include the portion paid by farmers and risk support provided by the Federal government. A loss ratio of 1.0 means that crop insurance payments equal the total premium. Loss ratios above 1.0 mean that payments exceed premiums and vice versa. When it sets premiums, the Risk Management Agency (RMA) aims to maintain a loss ratio slightly less than 1.0, thereby building loss reserve in ratings. The goal is to maintain this ratio over time. However, in any one year, the loss ratio may exceed 1.0 because of adverse weather and pricing events.
Over time, RMA has achieved its goal for the program in aggregate. RMA has regularly published loss ratios since 1989 in its Summary of Business (see Figure 1). In the first several years, overall loss ratios were high and above 1.0: 1.49 in 1989, 1.16 in 1990, 1.30 in 1991, 1.21 in 1992, and 2.19 in 1993. Since this high period, loss ratios generally have been lower. From 1994 to 2021, the loss ratio averaged .83.
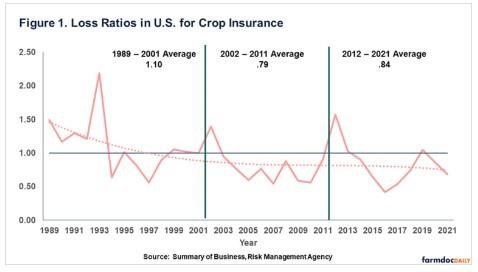
Loss ratios in Figure 1 are divided into three periods:
- 1989 – 2001 represents the early part of the modern Federal crop insurance program. During this period, many new products were introduced, with revenue products a significant introduction. Usage of crop insurance products increased during this period. For example, acres of corn insured in Illinois was less than 50% in 1989, increasing to over 60% by 2001 (see farmdoc daily, November 17, 2020). Loss ratios during this period averaged 1.10.
- 2002 – 2011 represents a period of a more mature crop insurance industry. Most of the commonly used revenue and yield products were in place for the entirety of this period, while growth in acres insured was still happening. Towards the end of the period, RMA began reevaluating the rating of individual crops beginning with corn and soybeans (see RMA). Corn and soybeans had relatively low loss ratios before the review. The average loss ratio during this period was .79.
- 2012 – 2021 represents the most recent years of performance of crop insurance. Generally, the crop insurance industry has reached relative maturity, with most acres of the largest produced crops insured. During the first year of this period, 2012, a major drought occurred in the Midwest, and the loss ratio during that year was 1.59. Even given the high loss ratio in 2012, the ten most recent years including 2012 to 2021 has an average loss ratio of .84.
RMA has been meeting its goal of maintaining an overall loss ratio below 1.0. Individual crops, however, could be above or below the 1.0 benchmark.
Evaluation of Loss Ratios by Crop
Individual crop loss ratios were evaluated, with a particular emphasis on the periods:
- 2002 – 2011 is the ten years preceding the ratings evaluation, and
- 2012 – 2021 are the ten most recent years.
A comparison of loss ratios is conducted for the 15 largest crops in terms of average yearly total premium from 2017 to 2021 (see Table 1). From 2017 to 2021, the total premium averaged $10,775 million. Corn (35% of total premium) and soybeans (22%) are the crops with the most premium. These two crops account for 57% of the total premium. As a result, the performance of the entire Federal crop insurance system is tied to these two crops.
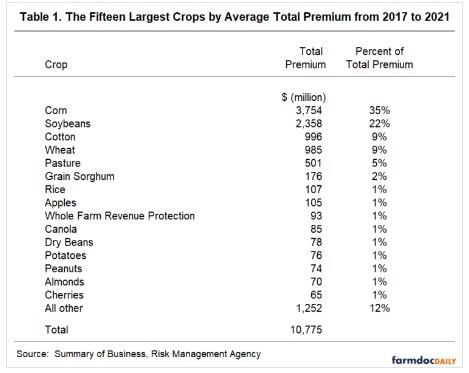
The next four crops are cotton (9%), wheat (9%), pasture (5%), and grain sorghum (2%). Insurance for pasture is relatively new, beginning in 2007. Another “crop” in the top 15 is “Whole Farm Revenue Protection,” a product that covers all commodities in one policy. Whole Farm Revenue Protection was introduced in 2015.
The top 15 crops account for 89% of the total premium in the last five years. The remaining 11% of premiums is spread over 120 other crops.
Loss Ratios by Crop
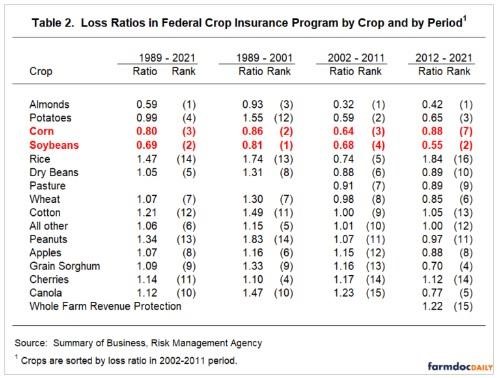
Table 2 shows the fifteen crops by period. Crops are ranked from lowest to highest loss ratio in the 2002-2011 period, immediately before the RMA began its re-rating efforts. For the 2002 – 2011 period, the five lowest crops in terms of loss ratio were almonds (.32 loss ratio), potatoes (.59), corn (.64), soybeans (.68), and rice (.74).
There is a correlation between the loss ratio in the 2002 – 2011 period and the 2012 – 2021 period, as is illustrated in Figure 2. The five crops with the lowest loss ratios in the 2002 -2011 period are labeled in Figure 2. Four of the five crops that were low in the 2002 – 2012 period also were low in the 2021 – 2021 period:
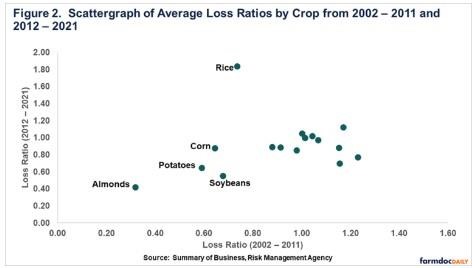
- Almonds had the lowest loss ratio from 2002 – 2011 and the lowest loss ratio from 2012 – 2021.
- Potatoes had the second lowest loss ratio from 2002 – 2012 and the third lowest from 2012 – 2021.
- Corn had the third lowest loss ratio from 2002 – 2011 and the seventh lowest from 2012 – 2021. Importantly the 2012 – 2021 period includes the 2012 drought year in which corn had a loss ratio of 2.74. Drought years like 2012 occur with some frequency but less than a one in a ten-year event. A one in twenty or one in a twenty-five-year event likely is closer to the occurrence rate. Without 2012, corn’s loss ratio would have been .66.
- Soybeans had the fourth lowest loss ratio from 2002 – 2011 and the second lowest from 2012 – 2021.
- Rice had the fifth lowest loss ratio from 2002 – 2011 and the highest of the fifteen crops from 2002 – 2021. Clearly, rice is an outlier among the other four crops with low loss ratios from 2002 – 2021.
Summary
Four of the 15 crops with the highest premium in recent years stand out as having low loss ratios: almonds, soybeans, potatoes, and corn. Soybeans and corn – the two crops with the largest premium – have loss ratios well below the 1.00 benchmark, even after a ratings evaluation that took effect in 2012. For RMA to maintain their loss goal, the overall loss ratio for corn and soybeans cannot be underrated given the large role of these two crops in the program. Still equity arguments can be made that all crops should have roughly the same ratio. Both soybeans and corn have relatively low loss ratios, and soybeans has a very low loss ratio.
Source : illinois.edu