Every year, the U.S. Dairy Export Council summarizes the key “signposts” our analysts will be watching in the year ahead. Like signposts on the road, these markers will help determine the course of U.S. dairy exports over the next 12 months.
This year, we’ve split the piece into two parts. In Part I, we focused on the macro factors that will influence all the major dairy products: milk production, input costs, supply chains and the macroeconomic environment.
Here in Part II, we’ll focus on one key signpost for each of the major U.S. dairy export products: Nonfat dry milk/skim milk powder (NFDM/SMP), cheese, proteins and butter.
Skim milk powder: How depleted are importers’ inventories? – William Loux
In 2021, NFDM/SMP trade was driven by the two largest single-country importers, China and Mexico. China’s booming domestic demand for dairy products combined with a strong desire to build security stocks after the country sat on the sidelines for much of 2020. Through November 2021, China imported 31% more SMP, an increase of nearly 100,000 metric tons (MT) over the same period the previous year.
Mexico increased its imports by 13%, a jump of more than 30,000 MT. However, in Mexico’s case the growth was attributable to the country recovering from the worst economic downturn since the Great Depression and the lowest powder import volume in four years.
Our key signpost for demand in 2022 will be the activity from the two buying regions that were quiet last year – the Middle East/North Africa (MENA) and Southeast Asia (SEA).
Both markets pulled back from the world market in 2021, though the decline from MENA (-14%, -51,380 MT YTD thru October) was much sharper than SEA (-1%, -6,872 MT) when looking at global trade from the major exporting regions. Some of this decline could be attributed to port congestion, a large inventory build in the early days of the pandemic, lower consumer demand or a combination of all three.
However, even accounting for these factors, we believe inventories in these markets have been significantly depleted. If we look at how annualized trade compares to the long-term trend, both major markets are sitting well below trend (see graph below).
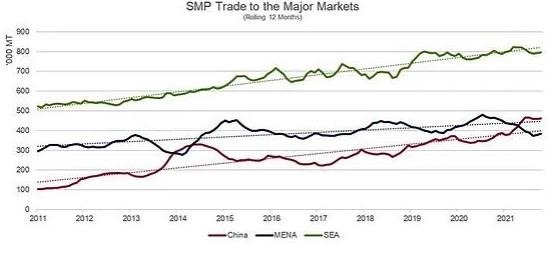
By our calculations, both MENA and SEA appear to be holding fewer days of inventory (roughly three fewer weeks for MENA and one week less for SEA) relative to the baseline trend, even when accounting for a 2020 stock build and declines in consumer demand. Using the same methodology and increased consumer demand, China has added about a month of additional SMP inventory. Obviously, take the calculation with a grain of salt given limited official inventory or consumption data, but the estimate aligns with in-market reporting.
Effectively, as we enter 2022, we expect both regions to be very active participants in SMP markets, potentially even building safety stocks in an era of shipping uncertainty. MENA and SEA participation should provide strong support to U.S. NFDM/SMP exports and prices, even if China purchasing dramatically slows or Mexico’s recovery hits an unexpected snag.
Cheese: How will Latin American demand fare? – Paul Rogers
Last year was a good one for cheese exporters. In the six years prior to 2021, global cheese trade expanded at an average rate of 2.4% per year. But last year, that growth rate spiked to 9% through November.
Global cheese demand has been robust, with increases across geographies. While part of the gain can be attributed to the rebound in foodservice business after the pandemic curbed 2020 demand, the numbers point to something stronger than just making up lost ground. Particularly, cheese demand is getting a boost from a region not always considered one of the world’s premier cheese buyers: Latin America.
When it comes to cheese import demand, countries like Japan, South Korea and China typically draw the headlines, and with good reason. Along with Russia, Saudi Arabia and the U.S., they are some of the largest cheese buyers in the world.
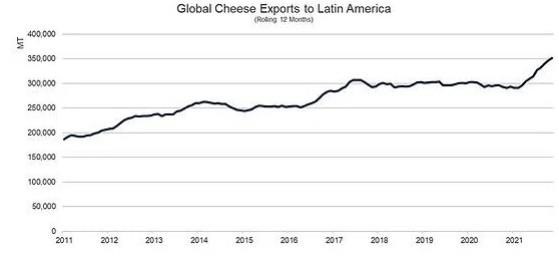
But one of the drivers of U.S. and global cheese trade in 2021 was our partners to the south. Year-to-date cheese exports by the world’s largest suppliers to Mexico, Central America, South America and the Caribbean were up 22% (+58,093 MT) vs. the previous year, according to the latest trade data reports through November. Collectively, they already exceed full-year, pre-pandemic 2019 volume with a month of volume yet to be added.
That does not even count the sizable intraregional trade, which is up as well.
Can we expect continued demand from the region to underpin cheese exports moving forward? This unprecedented pace may be an anomaly boosted by rebounding tourism and recovering demand in Mexico. However, even accounting for a potential slowdown in growth, the long-term trend suggests the region will become an increasingly important customer for U.S. cheesemakers.
Shipments to the rest of the Americas from the major cheese suppliers have been rising for more than a decade, growing from less than 200,000 MT in 2010 to over 350,000 in 2021 (a 3% decline in 2020 notwithstanding). The increase in volume over that stretch exceeds the increase in cheese exports to some of the world’s largest cheese buyers, including Japan (+101,645 MT), Korea (+93,332 MT) the Middle East/North Africa (+83,684 MT). A large portion of the scale is due to aggregating so many countries together. But regardless, the trend is clear – we have seen substantial increases in all the major buyers in Latin America. That growth should continue, providing business and leisure travel are permitted and deemed safe and economic growth continues at pace (see Part I for more info on Latin America’s economic outlook).
The trend is particularly significant for U.S. cheese suppliers. The United States holds about an 80% share of Mexico’s cheese import market, is the No. 1 supplier to Chile, Colombia, Peru and most of Central America, and enjoys the benefit of geographic proximity. So, looking ahead to 2022, even if there is a slowdown in trade resulting from the omicron variant or simply a regression to the mean, U.S. cheese exports should benefit from growing demand in the region.
Proteins: Will consumers stay focused on fitness? – Stephen Cain
Indicators point towards a growing global focus on health and wellness, which is a driver of high-value whey ingredient demand (including WPC80 and WPI). During the height of pandemic-induced lockdowns, gyms were some of the first establishments to close and some of the last to re-open. Since then, there has been a renewed focus on health and wellness, beyond just sports nutrition, as consumers return to and focus on living healthier lives.
Still, for 2022, we will be keeping a close eye on sports nutrition products, which make up a large and growing category for high-protein whey utilization – both domestically and internationally. These products include whey protein powder for muscle building and workout recovery, protein bars for sustained energy and a myriad of other products targeted at consumers focusing on their health here in the U.S. as well as in key importing markets.
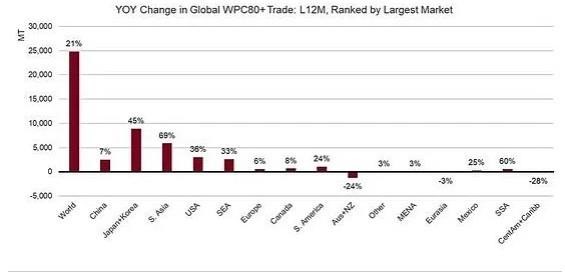
Globally, total WPC80+ trade (the best proxy available for high-protein whey trade) over the last 12 months has increased 21%, driven largely by the boom in Asian consumption (+27%), with the U.S. as a crucial supplier to that growing demand. Year-to-date (through November), U.S. exports of WPC80+ were up 12%, with strong gains to China (+12%), Japan (+40%) and South Korea (+48%). Unsurprisingly, these growth regions in Asia have a growing focus on sports nutrition.
A driver of increased high-value whey demand in Asia is the growth of the fitness industry. When discussing the fitness industry, gyms are a natural component. So, gym investment along with returns can be used as a proxy for demand and future growth.
The U.S. dominates the world in the number of gym facilities with more than 41,000; however, Asian countries lead in two other key metrics – annual revenue per gym and annual revenue per gym member.
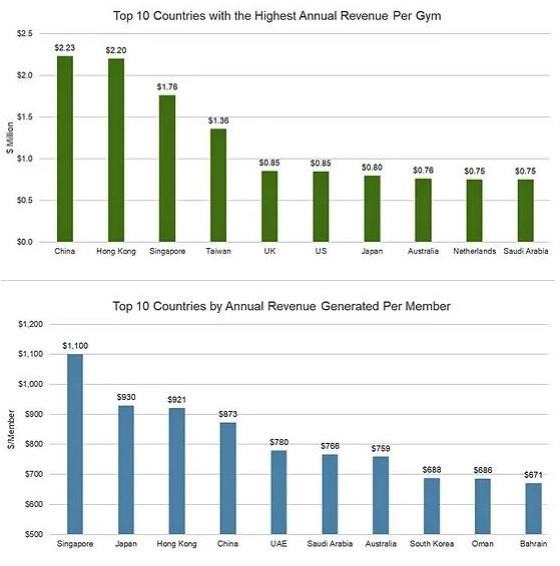
This high level of return per gym and gym member supports investment and is especially bullish when considering membership penetration levels. The U.S. has one of the highest gym membership penetrations in the world, with 21% of the population holding a gym membership. Asian countries have much lower penetration levels (1-9%) which shows a large potential for continued growth. Additionally, when looking at these numbers, it’s clear that GCC countries, where whey protein demand remains limited, present a key opportunity for future growth.
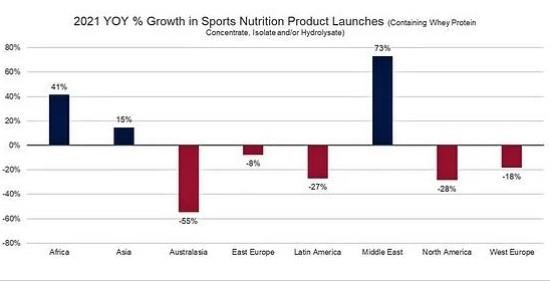
Along with gym investment and member penetration, another indicator of future growth in the health and wellness sector is new product launches, which attest to continued investment and upbeat sales expectations.
Asia, the Middle East and Africa lead the world in new dairy protein product launches in terms of percentage growth. Food companies in the Middle East launched 45 such products in 2021 (73% YOY increase), African companies rolled out 41 (+41% YOY increase). Still, Asian manufacturers are rolling out the greatest quantity of new products, having introduced 267 in 2021 (+15% YOY increase). This increased investment in the sector suggests continued and growing interest in these regions for high-value whey products. That is a bullish sign for demand outlook since these regions combined represent roughly 60% of the global WPC80+ demand.
The question is, will this growth and focus on health and fitness continue in 2022, and will that growth drive U.S. exports of sports nutrition ingredients like WPC80+?
In short, yes, we think the growth in the sector and focus on health and wellness bodes well for U.S. exports of products like WPC80+. The U.S. is the largest supplier of WPC80+ to the world (46% global market share) and is a major supplier to these high-growth regions, with a 42% market share in China, 41% in Japan, 73% in South Korea and 32% in MENA. Combined, the U.S. and the European Union supply 80% of the world’s WPC80+ demand. With EU future milk production growth in question, this puts the U.S. in an excellent position to maintain global market share and supply rising global demand in the face of lower output from global competitors as we move into 2022.
Chinese whey demand – Cain
China represents roughly 40% of global whey imports (~675,000 MT/year), and those imports are largely driven by the country’s tremendous pork production. Even after the outbreak of African Swine Fever (ASF) in 2019, China remains the world’s largest producer and consumer of pork. Following the dramatic fall in the swine herd in 2019, China’s pork industry embarked on a dramatic restructuring and investment surge driven by elevated pork prices resulting from the extreme supply and demand imbalance. Those elevated prices supported investment in the industry with producers seeing very healthy margins.
With these high pork prices, Chinese companies scrambled to rebuild the herd in order to cash in on favorable margins. As herd numbers grew, demand for whey went up and imports of whey skyrocketed in 2020 and early 2021.
Click here to see more...