By Scott Irwin
The USDA released a number of important reports for the grain markets on January 10, 2019, including the quarterly Grain Stocks report, Annual Crop Production Summary, and the monthly World Agricultural Supply and Demand Estimates (WASDE) report. In addition to all the estimates that garnered headlines, the USDA also released much less noticed revisions to production, ending stocks, and feed and residual use for corn for the 2018/19 marketing year. While these revisions were not large in absolute terms and appeared rather unremarkable, they actually represented a potentially major shift in USDA methods for revising corn balance sheets and may have far-reaching implications for perceptions about the accuracy of USDA survey-based estimates of production and stocks. The purpose of this article is examine the nature of the USDA revisions to the 2018/19 corn balance sheet and the broader implications for understanding and interpreting USDA estimates in the future.
Analysis
We begin with a discussion of the basics of constructing a balance sheet for a commodity. In essence, the basic idea is a complete accounting for the sources of supply and use (or demand), with the end goal of the two perfectly balancing each other. In mathematical terms, this basic balance sheet relationship is expressed as follows for a given marketing year:
(1) Beginning Stocks + Production + Imports – Domestic Use – Exports – Ending Stocks = 0.
Note that beginning stocks, production, and imports sum to total supply and domestic use, exports, and ending stocks sum to total use. vIf all categories in the balance sheet are measured perfectly and there is no wastage in the system, then total supplies will always balance total uses. However, in reality this is never the case, so a residual use category must be added as follows:
(2) Beginning Stocks + Production + Imports – Domestic Use – Exports – Residual Use – Ending Stocks = 0.
The residual use category impounds any measurement errors in the other supply and use categories as well as waste from spillage, spoilage, etc. in storage and transportation.
With this background, we can discuss how the basic balance sheet identity in (2) is applied to the corn, which we represent as follows:
(3) Beginning Stocks + Production + Imports – Food, Seed, and Industrial Use – Exports – Feed and Residual Use – Ending Stocks = 0.
Since the supply side of the balance sheet is basically the same for all storable commodity markets, the differences across markets are found in the use categories. In addition to ending stocks, the corn balance sheet typically has three use categories, reflecting the major categories of corn consumption. These are: i) food, seed, and industrial use, which includes ethanol, ii) exports, and iii) domestic feed and residual use. The latter category requires some explanation. Both feed use and residual use are considered “unmeasured” components of the corn balance sheet because direct survey estimates from public agencies are not available or stable relationships to known variables are difficult to obtain. For these reasons, feed use and residual use for corn are lumped into one “residual” category.
We can now review the typical process used to imply feed and residual use in the corn balance sheet. It is helpful to rewrite the corn balance sheet relationship as follows to align with “measured” and “unmeasured” data for a given marketing year:
(4) Beginning Stocks + Production + Imports – Exports – Food, Seed, and Industrial Use – Ending Stocks = Feed and Residual Use.
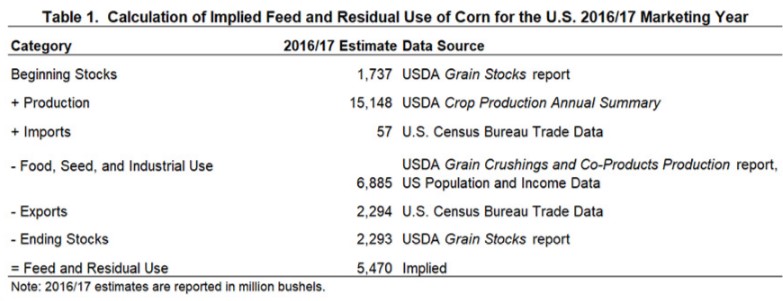
All of the measured components for the corn balance sheet appear to the left of the equal sign and the net of these components by definition equal feed and residual use. Table 1 provides a specific example of the application of this relationship to the calculation of feed and residual use for the 2016/17 U.S. marketing year for corn. Notice in particular the data source listed for each component of the corn balance sheet except feed and residual use. After the 2016/17 marketing year was completed, beginning stocks for September 1, 2016 and ending stocks for August 31, 2017 could be collected from USDA Grain Stocks reports. A final production estimate could be obtained from the USDA Crop Production Annual Summary. Both imports and exports could be collected from the U.S. Census Bureau Trade data. The largest component of food, seed, and industrial is corn processed into ethanol and co-products, and this could be obtained directly from the USDA Grain Crushings and Co-Products Production report. The remainder of food, seed, and industrial use is quite stable from year-to-year and could be estimated quite accurately based on relationships to U.S. population and income growth. The net difference between the “measured” supply and use categories is 5,470 million bushels, and this is the USDA implied feed and residual use estimate for the 2016/17 marketing year.
It bears repeating that the implied estimate of feed and residual use is traditionally considered to contain the most uncertainty of any component in the corn balance sheet as there is no official measure or method to track corn disappearance into animal feeds. It is often argued that corn feed and residual use should have a consistent relationship to changes in livestock numbers and availability of other grains for feeding. First, this ignores the well-known tendency of feed and residual use in corn to vary with the size of the corn crop, most likely reflecting a residual “wastage” component that is a percentage of crop size rather than an absolute number of bushels. This leads to a positive correlation between feed and residual use and crop size that is larger than many appreciate. Second, this ignores the fact that imputed feed and residual use impounds any errors in the “measured” components of the corn balance sheet. This is likely to be most problematic for USDA corn production estimates, which are by far and away the largest single estimate used in the imputation process for feed and residual use. Irwin, Sanders, and Good (2014) note that the sampling error for any particular final USDA corn production estimate could easily be several hundred million bushels.
This discussion should make it clear why the USDA in the past has been averse to revising “measured” balance sheet components, like production and stocks, based on “unmeasured” feed and residual use, even if the level of feed and residual use appeared to be significantly out-of-line with livestock numbers. If feed and residual use was not moving consistently with livestock numbers, market analysts could reasonably infer this reflected “unresolved” sampling errors in either production or stock estimates (Irwin, Sanders, and Good, 2014). While one could infer that sampling errors in production or stock estimates were the culprit, there is no way in practice to disentangle the sources of error between production, stocks, and feed use without first having a rigorous survey-based measure of corn feed use. Otherwise, the USDA would be forced to revise survey-based measures of production and stocks using highly uncertain past relationships of livestock numbers to feed and residual use.
From this perspective, the revisions announced last Friday January 10th to the 2018/19 U.S. corn balance sheet were quite surprising. Table 2 lists the USDA balance sheet estimates for 2018/19 in the
December 2019 WASDE report versus the estimates in the
January 2020 WASDE report. At first glance, the changes appear rather unremarkable and are not large in terms of absolute magnitude. Area planted and harvested was reduced, with yield held constant. This dropped total production by 80 million bushels. At the same time, feed and residual use was increased by 186 million bushels and ending stocks were increased by 107 million bushels. The revelation was the USDA’s motivation for making these changes. A special note to the
January 2020 Grain Stocks report indicated that, “After a thorough review of the balance sheet for the 2018 corn crop, NASS determined that revisions were necessary for the 2018 production and September 1, 2019 stocks estimates.” Since USDA/NASS did not have any new survey data on 2018 production or September 1, 2019 stocks available, the statement strongly implied that the main driver for making the changes was the level of feed and residual use. Further communication with USDA officials confirmed that the level of feed and residual use was key to making the revisions.
The revisions to the 2018/19 corn balance sheet by the USDA are quite puzzling for two reasons. First, to the best of this author’s knowledge, this is the first time the USDA has used the “unmeasured” feed and residual component for a given marketing year to revise the “measured” production and ending stocks components for the same marketing year without having new data on production and/or stocks available. This reverses a long precedent of living with unresolved sampling errors impounded into feed and residual use for corn because of the assumed greater accuracy of survey-based production and stock estimates. Second, the USDA changed both production and ending stocks for 2018/19 in response to the apparent desire to revise feed and residual use. This is tantamount to saying that the unresolved sampling errors in production were negative and stocks were positive. This assumes a great deal of knowledge about the sampling errors in each. Even in the case of soybeans at the end of the marketing year when the USDA frequently makes balance sheet revisions based on data in the quarterly Grain Stocks report, changes are only made to production in the previous year, never to production and stocks at the same time. The motivation for changing both production and ending stocks for 2018/19 is puzzling indeed.
Figure 1 provides further perspective on the nature of the USDA’s revisions to the 2018/19 corn balance sheet. This figure plots USDA estimates of corn feed and residual use for the 2017/18 through 2019/20 marketing years as published in December 2019 versus January 2020. The estimates published in December showed corn feed and residual use in 2018/19 surging over 5.6 billion bushels and then dropping sharply in 2019/20 to under 5.3 billion. This trajectory did not line up with increasing livestock numbers in the last year. It appears that the USDA simply wanted to smooth feed and residual use across the three marketing years and this required making the aforementioned revisions to production and stocks for the 2018/19 corn balance sheet. While this is reasonable from the perspective of livestock numbers, it begs the questions of how to estimate the “right” path of corn feed and residual use based on available data and procedures.
Implications
USDA balance sheet estimates of supply and use are an important benchmark for virtually everyone in the grain markets. It is not surprising that changes to USDA methods and procedures need to be carefully considered and communicated to market participants. On January 10th the USDA released what appeared to be relatively minor revisions to production, ending stocks, and feed and residual use for corn for the 2018/19 marketing year. In reality, this is the first time in recent memory that USDA has used the “unmeasured” feed and residual component for a given marketing year to revise the “measured” production and ending stocks components for the same marketing year without having new data on production and/or stocks available. This reverses a long precedent of living with unresolved sampling errors for production and stocks impounded into feed and residual use for corn because of the assumed greater accuracy of survey-based production and stock estimates. If this is not a one-off event, it raises profound questions about the confidence that USDA has in the accuracy of its own survey estimates of production and stocks.
Source : farmdocdaily