By Joana Colussi and Nick Paulson et.al
This article examines the distribution and variability of production in the southern hemisphere as a follow-up to the July 31, 2023 farmdoc daily that found production of corn, soybean, and wheat varies more in the southern than the northern hemisphere. The southern hemisphere’s increasing share of global production of major crops underscores the need to understand the diversity and variability of its production. South America is the largest producer of corn, soybeans, and wheat in the southern hemisphere. Wheat production in Oceania is particularly variable. Deviations from trend production are positively related, and statistically significant, for corn in South America and Sub-Saharan Africa and for wheat in South America and Oceania. Variations for these crop-region combinations reinforce one another as both tend to be above or both tend to be below trend in the same year.
Data:
Data were obtained for the 1977/78 (hereafter, first year is used) – 2022 crop years from the Production, Supply, and Distribution Online database (U.S. Department of Agriculture, Foreign Agriculture Service). 1977 is the first year soybean production data are reported for Argentina and Brazil. Data for the 2022 crop year are estimates as of mid-August 2023. The southern hemisphere is defined to be Oceania, South America, and Sub-Saharan Africa.
Distribution of Production:
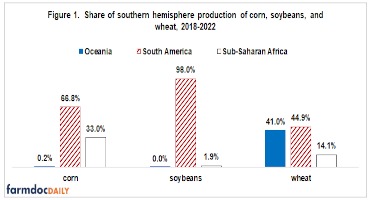
Distribution of production in the southern hemisphere varies by crop (see Figure 1). Corn is produced almost exclusively in South America and Sub-Saharan Africa. Soybeans are produced almost exclusively in South America. Wheat is grown in each region. The share of corn and wheat produced in South America has increased somewhat over time. During 1977-81, its share averaged 56% for corn and 40% for wheat.
Australia accounts for 98% of wheat production in Oceania. South Africa is the largest corn and wheat producer in Sub-Saharan Africa, but its share declined notably from 1977-81 to 2018-22 as production increased faster in other countries. South Africa’s share declined from 43% to 19% for corn and from 60% to 21% for wheat.
Variability of Production:
Percent variation of reported production from trend production is calculated for each year. Trend production is estimated within the sample for each region whose share of corn and wheat production averaged at least 10% of southern hemisphere production in 2018-22. No comparison is made across southern hemisphere regions for soybeans because South America accounts for 98% of production.
The estimated trendline production equations for corn are curvilinear, indicating corn production in South America and Sub-Saharan Africa has increased at an increasing rate since 1977. Explanatory power of the time trend variable is 97% for both regions. The trend equations are linear for wheat in South America and Oceania, indicating wheat production has increased at a constant rate in these two regions. In contrast, the trend equation for wheat in Sub-Saharan Africa is curvilinear, indicating production has grown at an increasing rate. Explanatory power of the time trend variable for wheat production varies notably by region: 90% for Sub-Saharan Africa, 76% for South America, and 42% for Oceania. The estimated equations are listed in the Data Note (see below).
Production variability, as measured by the standard deviation of the annual percent variation of production from the trendline, is highest for wheat in Oceania (see Figure 2). It is twice the variability of wheat production in South America and Sub-Saharan Africa. Production variability of corn is lower than for wheat, but, like wheat, is similar in South America and Sub-Saharan Africa.
Relationship between Production Deviations:
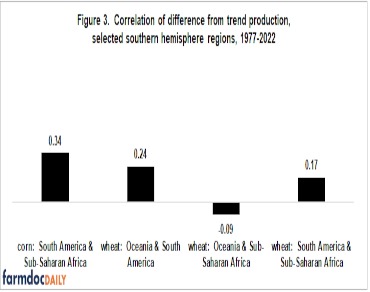
While small, the positive correlation between the deviations from trendline for corn produced in South America and Sub-Saharan Africa is significant at the 98% level of statistical confidence. A tendency thus exists for corn production in South America and Sub-Saharan Africa to either both be above trend or both be below trend. The positive correlation for wheat in South America and Oceania is significant with 94% statistical confidence. A tendency thus exists for wheat production in these two regions to either be both above trend or both below trend. The other two correlations do not differ from zero at the 90% level of statistical confidence, implying that deviations of wheat production from trend in these pairs of regions are not related.
Discussion
South America is the largest producer of corn, soybeans, and wheat in the southern hemisphere, but substantial production of corn occurs in Sub-Saharan Africa and of wheat in Oceania. Production of wheat in Oceania is particularly variable relative to trendline production.
As the southern hemisphere increases its share of global production, it is important to understand the variability of production in the three regions that compose the southern hemisphere. It is especially important to track how production variability is related among these regions since positively-related variability increases the variability of world prices and supply, assuming other factors do not change.
The data used in this analysis reveals that historical deviations from trend production for corn in South America and Sub-Saharan Africa have tended to reinforce each other as both regions tend to be above or below trend. The same situation exists for wheat in South America and Oceania. It is thus important to track joint production deviations in these pairs of regions in the near future and to assess if the historical relationships continue to hold.
A subsequent article will examine the relationship between deviations from trend production of corn, soybeans, and wheat for regions in the northern hemisphere, allowing an interesting comparison with the southern hemisphere.
Data Note – Estimated Trend Production Equations:
(units are in million metric tons; time is a count variable starting with 1 for 1977/78):
corn South American trend production = 39.139 – 1.454 (time) + 0.097 (time squared); R2 = 97%
corn Sub-Saharan Africa trend production = 26.431 -0.531 (time) + 0.041 (time squared); R2 = 97%
wheat Oceania trend production = 11.817 + 0.350 (time); R2 = 42%
wheat South American trend production = 11.745 + 0.360 (time); R2 = 76%
wheat Sub-Saharan Africa trend production = 3.541 -0.022 (time) + 0.003 (time squared); R2 = 90%
Source : illinois.edu