By Jonathan Coppess
The potential for a 2023 farm bill reauthorization appears to have made little progress going into the annual August Congressional recess, but has picked up more warnings about potential problems ahead (see e.g., Downs and Hill, July 31, 2023; Hill, July 27, 2023). Into this uncertain situation, the National Corn Growers Association (NCGA) recently voted on a proposal that the upcoming farm bill reauthorization should require a mandatory base acre update (Clayton, July 27, 2023; Brasher, August 2, 2023; Abbott, August 2, 2023; Red River Farm Network, July 24, 2023). This article further reviews base acres issues, building upon the previous article’s review of the historical development of this policy design (farmdoc daily, July 20, 2023).
Background
As discussed in the previous article, the Agriculture Risk Coverage (ARC) and Price Loss Coverage (PLC) programs make payments on the base acres enrolled rather than the acres planted. For ARC, farmers can elect to enroll base acres in either individual level coverage (ARC-IC), which combines all base acres of all covered commodities on the farm, or the county option (ARC-CO), which uses average yields in the county. The decision to enroll base acres between ARC-CO and PLC is for each program crop’s base acres, while ARC-IC is an all-in decision for all program crop base acres. With the Agricultural Act of 2014, farm owners were permitted a one-time option to reallocate—but not to increase—the base acres on the farm (P.L. 113-79). Farmers then elected to enroll the base acres in PLC or ARC (either ARC-CO or ARC-IC), a decision that could not be changed for the 2014 to 2018 crop years. In the Agricultural Improvement Act of 2018, Congress provided farmers the option to revisit the election for the 2019 and 2020 crop years and then each year for the 2021 to 2023 crop years (P.L. 115-334). Figure 1 illustrates the total base acres enrolled in PLC, ARC-CO, and ARC-IC for each of the 2014 through 2023 program years, as reported by the Farm Service Agency (USDA-FSA, ARC/PLC Program Data).
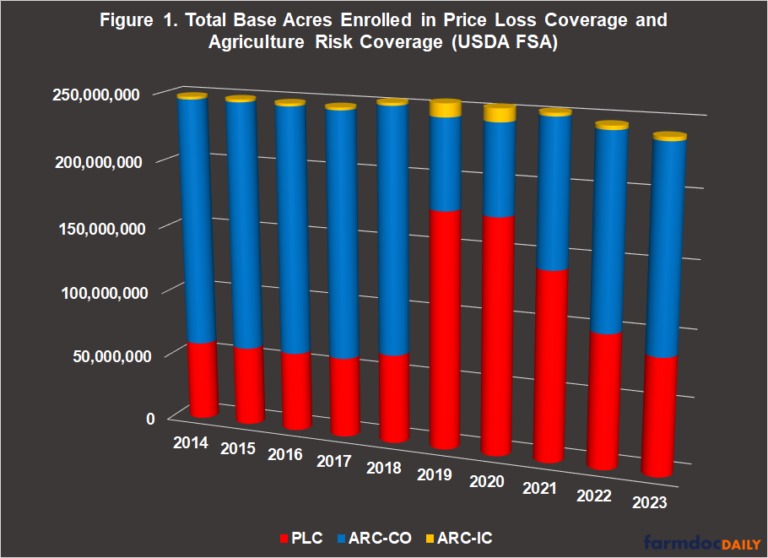
On average from 2014 to 2023, FSA reports total enrolled base acres of 248.4 million base acres with almost 99 million (40%) enrolled in PLC, 145.6 million (59%) enrolled in ARC-CO, and 3.8 million (1.5%) enrolled in ARC-IC. Under the 2014 Farm Bill, approximately 75% of the total base acres were enrolled in ARC-CO and just under 25% in PLC, while less than 1% were enrolled in ARC-IC. This enrollment reversed under the 2018 Farm Bill with nearly 70% enrolled in PLC for 2018 and 2019 and 26% in ARC-CO, with almost 4% in ARC-IC. Since 2020 and the annual decision, enrollments have trended in favor of ARC-CO which has increased from 43% in 2021 to over 62% in 2023 while PLC has dropped from 56% to 36% in those years. Also of note, total enrolled base acres peaked at 253.6 million in 2019 but have fallen back to 239.7 million in 2023, which would be the lowest total in the ten years of the PLC and ARC programs. Since 2019, base acres enrolled in these programs has decreased a total of 13.9 million base acres. This total, however, could be the result of incomplete reporting for the 2023 program year.
Discussion
Use of base acres to make farm program payments decouples those payments from planting and production decisions (Rosch and Whitt, CRS, May 31, 2023). One of the primary arguments for this policy design is to avoid having federal payments influence farmer decisions on which crop to plant in any crop year. This is particularly of concern when prices are low and a federal incentive to plant a crop into a down market could cause further damage and problems. A significant challenge for this policy design is that the federal assistance does not align well with actual farming or crop production risk. A farmer can receive payments for crops not planted, while not receiving payments for crops that were planted. Decoupling payments decouples the assistance from any actual risk of producing the crop and is magnified by use of a national marketing year average (MYA) price calculation that pushes payments a year after the crop was harvested. One argument for updating base acres is to better connect the programs to more recent crop rotations and farm management, but that also risks influencing planting decisions in the future. If Congress were to mandate an update to base acres, the policy is likely to use an average of the acres planted since the last farm bill and this discussion reviews averages for the five years of the current farm bill authorization, 2019 to 2023.
The major program crops (barley, corn, soybeans, wheat, upland cotton (seed cotton), all rice (long grain, short/medium grain and temperate japonica), peanuts, oats, and sorghum) account for over 98% (244.4 million) of the total enrolled base acres. Figure 2 presents an interactive map of the average acres planted to the major program crops by state and as reported by the National Agricultural Statistics Service (USDA-NASS, Quickstats). Note that in previous base acre calculations Congress has included acres prevented from being planted which are not included in the NASS data. The map also includes each state’s share of the average total acres (2019-2023) planted to these crops, as well as the share of the total average acres planted in the State for each of the major program crops. For example, Iowa averaged the most acres planted to these major program crops from 2019 through 2023 with over 23 million acres (9.27% of the national acres planted). In Iowa, on average 57.31% of the acres planted were to corn and 41.97% were planted to soybeans.
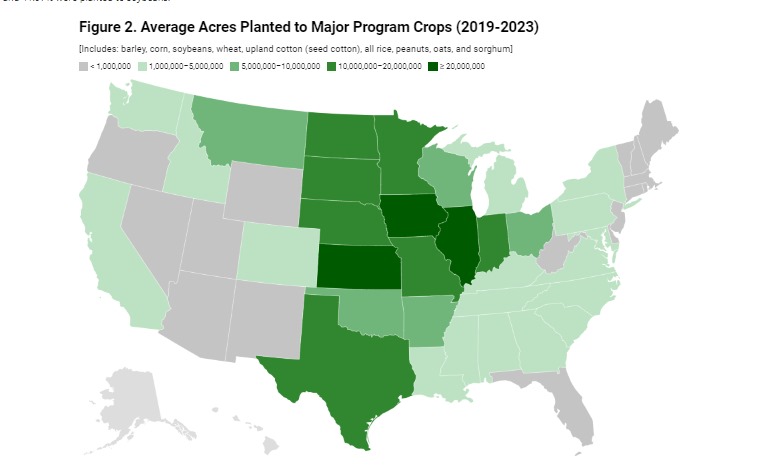
From 2019 to 2023, corn and soybeans were the two largest program crops in terms of acres planted. Farmers planted an average of 91.3 million acres to corn, which accounted for 37% of the average acres planted to these major program crops. Farmers planted an average of 83.5 million acres to soybeans, which accounted for 33.5% of the acres planted to the major program crops in these years. The next closest crop was wheat, which averaged 46 million acres planted and 18.6% of the total to the major program crops. By comparison, the average enrolled base acres in these years (2019-2023) contain significant differences. While corn remains the largest program crop with an average of 94 million (38%) base acres enrolled in ARC and PLC, wheat and soybeans trade places. Wheat is the second largest crop in terms of enrolled base (averaging 62.8 million (26%) from 2019-2023) and soybeans the third largest (averaging 53.3 million (22%) enrolled base acres from 2019-2023). Figure 3 illustrates a comparison between average acres planted (not including prevented planting) and average enrolled base acres for the major program crops from 2019 to 2023.
For further perspective, Figures 4a and 4b compare the over/under of enrolled base acres and planted acres for each year 2019 to 2023, which produces the average differences visible in Figure 3. Figure 4a illustrates each year’s total enrolled base acres minus the total acres planted to each major program crop. Figure 4b presents the same data with total enrolled base acres as a percent of the total planted acres for each major program crop each year.
Notable in Figures 4a and 4b are the degrees to which soybeans are under based, with substantially more planted acres than enrolled base acres; on average, enrolled base acres for soybeans are 64% of planted acres, or almost 30 million acres less. By comparison, wheat is over based, with substantially more base acres than planted acres; on average, base acres for wheat are almost 136% of planted acres, or 16.4 million acres more enrolled base than planted acres. In terms of enrolled base acres as a percent of planted acres, wheat is not the most over-based: barley base acres average 186.6% of planted acres, all rice base acres average 177.6% of planted acres, and peanut base acres averaged 159.5% of planted acres. The data on upland cotton (planted) and seed cotton (enrolled base) also raise questions, with planted acres averaging 12.2 million from 2019 to 2023 and enrolled base acres averaging 10.7 million but with a significant decrease in 2022 and 2023 of enrolled base acres for seed cotton. Average seed cotton enrolled base acres for 2019 to 2021 exceed 12.5 million but fall to an average of 8.1 million for 2022 and 2023; seed cotton enrolled base goes from 103% of acres planted to 67%.
Figures 3, 4a, and 4b highlight some of the political difficulties for a mandatory base acre update in Congress. Program crops like soybeans would gain significant base acres from an update while crops like wheat, rice and peanuts would lose significant base acres. Of course, this presents only part of the political problem. The impacts of a mandatory base update on the major program crops will have different impacts from state-to-state. Figure 5 provides perspective on the impacts by State with an interactive map presenting the difference between average acres planted (not including acres prevented from being planted) to the major program crops in 2019 to 2023 and the average base acres enrolled in ARC-CO and PLC for those years. Note that this comparison is not exact because the average enrolled base acres do not include those enrolled in ARC-IC. Moreover, the comparisons do not include the approximately 2% of enrolled base acres for the other program crops (i.e., other oilseeds, pulse crops, etc.), but those crops are also not included in the planted acres calculations. For the 2019 to 2023 program years, FSA reports base acres enrolled by crop and county for ARC-CO and PLC, but not ARC-IC, and this is the data used in Figure 5 for state-by-state comparisons (USDA-FSA, ARC/PLC Program Data). In other words, Figure 5 potentially overstates the reductions in base acres but not by much. Of the major program crops, not including ARC-IC matters most for soybeans with the highest percentage enrolled in ARC-IC each of 2019 to 2023 (6.3%, 6.2%, 1.3%, 1.3%, and 1.2%, respectively), followed by corn (5.9%, 5.8%, 1.4%, 1.4%, and 1.3%, respectively).
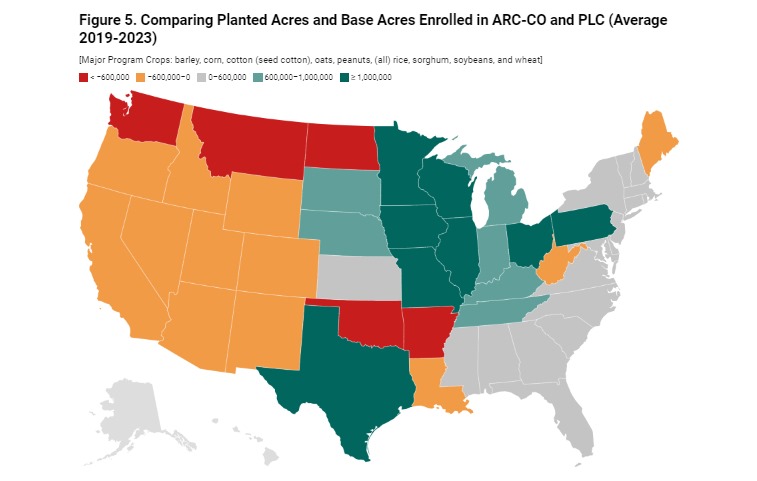
The perspective in Figure 5 does make clear the political difficulties for a mandatory base update, beginning in Arkansas. By this measure, Arkansas could potentially lose 647,132 base acres in a mandatory update—gaining 520,070 base acres of corn and 610,056 base acres of soybeans but losing 202,369 base acres of seed cotton and 610,785 base acres of wheat. Oklahoma could have base acres reduced by as much as 1.3 million, nearly 2.1 million fewer wheat base acres. Similarly, Montana could have 2.3 million in reduced base acres and 1.4 million for wheat. While North Dakota could gain 2.1 million soybean base acres and 395,000 corn base acres, it could potentially lose as many as 2.6 million wheat base acres and a total of 641,877 fewer base acres for these crops (note that prevented planting could be a significant factor in North Dakota acres if those are included). What makes the shifts or reductions in base acres further politically significant is the intersection of base acres and reference prices, which will be explored in a subsequent article (see e.g., farmdoc daily, March 2, 2023).
Concluding Thoughts
There are three basic arguments or justifications for requiring a mandatory base acre update in the 2023 farm bill reauthorization debate: (1) improved equity or fairness in the programs; (2) better align payments with reality; and (3) produce CBO savings to use as an offset. Each of these distill to a critical point about base acres: the policy was designed to address one problem of farm support payments (i.e., influencing farmer planting decisions particularly when prices are low), but inherited or created problems as a result; the problems with base acres, in other words, are a feature of the policy design not a bug. Addressing this design presents tradeoffs; none of which want for complications. The following is an attempt to unpack these matters further.
First among the arguments for an update are issues of equity. Because payments are made on base acres instead of planted acres, farmers who plant the same crops can receive very different payments. Soybeans provides the primary example; each crop year, there are roughly 30 million acres of soybeans planted on base acres of crops other than soybeans. When those base acres are peanuts, rice, or seed cotton, farmers receive substantially more in federal payments than farmers planting soybeans on soybean or corn base. Base acres also likely incorporated more troubling equity concerns to the extent those base acres inherited past discrimination by USDA officials. For example, discrimination in the FSA loan programs could have been incorporated in the planting histories for some farms, as could have any discrimination in establishing base acres by local officials denying or reducing base acres for some farmers (see e.g., farmdoc daily, March 25, 2021). Finally, beginning farmers are at a distinct disadvantage in competing with established farmers if the beginning farmer lacks base acres but the established farmer has base acres and thereby receives payments. For all such inequities, the larger the payment per base acre the more the problems are magnified every crop year.
Second, a mandatory base update would arguably better align farm program payments with recent farm management decisions, mostly crop rotations. ARC and PLC payments have a rather attenuated connection to actual production risks (i.e., payments are decoupled from what was planted and at risk, payments are a year after the crop was harvested and use national average prices in the calculations). The last base update was more than 20 years ago (2002) with no changes other than the option to reallocate in 2014; if base acres were not updated in 2002, they might reflect planting decisions from the early 1990s. A mandatory base update would improve that to some degree but also present challenges. For one, if farmers expect future base updates, they could adjust planting decisions as a result and seek to maximize program benefits rather than respond to market signals. An update is also challenged by the impacts of the Renewable Fuels Standard on corn acreage, increasing the acres planted to that crop. And soybeans, more than any other program crop, has vastly expanded its acreage footprint since 1996.
Third, an argument for mandating a base acreage update could provide much-needed savings in the Congressional Budget Office projections. Much of this savings would be shifting base acres out of crops with high reference prices and PLC payments (seed cotton, rice and peanuts, as well as wheat) into soybeans with much lower reference prices and almost no expectation of PLC payments. Here again, on average 30 million acres of soybeans are planted to other program crops and receive payments that would not be received if those were soybean base acres. This update would, however, also complicate any effort to increase reference prices for soybeans, increasing the cost of doing so on more acres. There might also be savings from the apparent decrease in total enrolled base acres: there were 13.9 million fewer enrolled base acres in 2023 than in 2019, however, this could be an issue with reporting and the totals for 2023 may not be complete (FSA reports them as of July 5, 2023). Some of these acres have likely gone out of farming and would be removed from the program; some of these acres may have been enrolled in the Conservation Reserve Program and be temporarily suspended but with the potential of being restored at the end of the contract. One concern could be that a mandatory base update might encourage farmers to exit CRP contracts early or not renew those contracts, and acres that are environmentally sensitive or of concern could be returned to intensive production.
Maybe the best summary of base acres policy is to paraphrase a quote attributed to Winston Churchill: it is the worst policy except for all of the other policies that have been tried before (see e.g., Churchill, November 11, 1947). There are good reasons for requiring a mandatory base acre update in a farm bill reauthorization. There are at least an equal number of reasons Congress would decide not to do so, some of them justifiable and others simply political or factional. There is also little that is new about this issue arising in a farm bill debate, nor about the challenges presented by the base acres puzzle (see e.g., McIntosh, Shogren, and Dohlman, 2007; Coble, Miller, and Hudson, 2008; Bhaskar and Beghin, 2010; Zulauf, 2013; Smith and Goodwin, 2013; Newton, 2017). The discussion in this article seeks to add information and perspectives on the policy design, it is not intended as an endorsement of, nor opposition to, any policy proposal.
Source : illinois.edu