By Scott Irwin and Todd Hubbs
Department of Agricultural and Consumer Economics
University of Illinois
The first step in any effort to project soybean yields is estimating the trend, which is the “launch point” when forecasting. As the summer growing season progresses favorable conditions push projections above trend and unfavorable conditions push projections below trend. A variety of issues are presented when estimating soybean trend yields and these have been investigated in previous farmdoc daily articles (February 8, 2012; March 19, 2015). The purpose of this article is to examine the sensitivity of trend projections for the 2020 U.S. average soybean yield to the starting year of the estimation period. The analysis mirrors that found in a farmdoc daily article last week (June 11, 2020) for corn, where we found that linear trend yield projections for corn in 2020 can vary by as much as 4 bushels per acre simply based on the starting year used for the estimation period.
Analysis
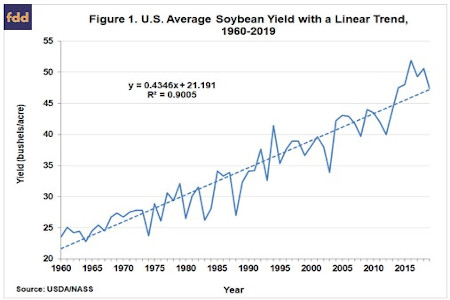
As shown in Figure 1, U.S. average soybean yields have trended higher since 1960, which we consider to be the starting year of the modern period of soybean production. A linear trend fit to actual average yields over that period explains 90 percent of the variation in annual average yields, and indicates that yields have increased at a rate of 0.44 bushels per acre per year. An alternative sometimes considered is the log-linear trend model (take the natural logarithm of yield before regressing on a time index), but this model also implies that the range of trend yield deviations in bushels should expand across time which clearly does not happen. It should also be noted that an important property of the linear trend model is that the percentage change in trend yields declines over time as the same bushel increase in trend yield is divided by a larger and larger base. This is consistent with the history of U.S. average soybean yields since 1960.
The next step of the analysis is to project soybean trend yields for 2020 by varying the starting year of the trend estimation. The procedure we follow is: i) estimate a linear trend model for 1960-2019 and project the trend yield for 2020 based on the regression estimates (this is the model shown in Figure 1); ii) estimate a linear trend model for 1961-2019 and project the trend yield for 2020 based on the regression estimates; and iii) continue this procedure moving the starting year forward one year at a time through 2000. The shortest sample period we consider is 2000-2019 in order to assure that all sample periods have at least 20 observations. This procedure generates 41 separate estimates of the trend for the U.S. average soybean yield in 2020.
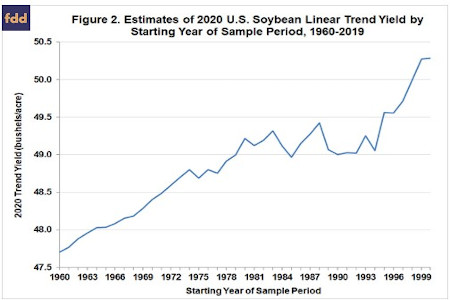
Figure 2 shows the projections of 2020 soybean trend yields by different starting years for the sample estimation period. Three distinct periods are present. Sample periods starting in the 1960s and the 1970s consistently generate rising 2020 trend estimates, from about 47.5 to 49.5 bushels per acre. This is followed by a period of flat trend estimates at around 49.5 bushels per acre in the 1980s and first half of the 1990s. Rapidly rising 2020 trend yield estimates are generated for sample periods starting in the mid-1990s, peaking at 50.3 bushels per acre for the 2000-2019 sample period. Similar to our previous results for corn (farmdoc daily, June 11, 2020), there is considerable sensitivity of trend yield estimates to the selected sample starting year. The range of about 2.5 bushels per acre in the estimates represents a swing of approximately 207 million bushels in soybean production estimates for 2020. This computation assumes 82.8 million harvested soybean acres provided in the June WASDE report.
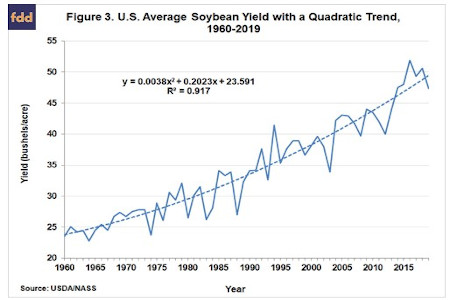
The reason linear trend yield projections peak for samples starting in the late 1990s can be seen in Figure 1. It appears that some type of shift in the rate of growth in U.S. average soybean yields began after 2012, and samples that include a relatively greater percentage of observations from this period will tend to produce higher trend yield estimates. The reasons for this shift are not well understood, but likely include changing production practices in southern U.S. soybean producing areas, earlier planting, and genetic improvements. Because of these changes, the trend in U.S. average soybean yield may now be non-linear rather than linear. Figure 3 shows a quadratic trend fit to U.S. soybean yields over 1960-2019, and this model fits years after 2012 much better than the linear model in Figure 1. The predicted 2020 trend yield for soybeans based on this quadratic model in Figure 3 is 50.1 bushels per acre. This is very close to the linear trend yield estimate using the shortest sample period in Figure 2 (2000-2019).
A final issue is raised by the fact that the 2020 trend yield estimates, whether they are based on linear or quadratic regression models, are “unconditional.” This methodology actually results in a slight under-estimate of trend yield due to the asymmetric effect of weather on actual yields (e.g., Swanson and Nyankori, 1979). That is, poor weather reduces yields more than good weather improves yields so that the impact of technology (trend) is under-estimated due to sharp reductions in yield from poor weather years, such as 1974, 1983, 1988, 1993, and 2012 (for those with a statistical bent this is more formally known as an omitted variables bias). The level of bias was estimated to be about 0.2 bushels per acre in a previous farmdoc daily article (March 19, 2015), but this is only a rough guide and not the result of any detailed analysis.
Implications
Trend yield and harvested acreage projections are foundations for early season forecasts of U.S. soybean production. We find that linear trend yield projections for soybeans in 2020 can vary by as much as 2.5 bushels per acre simply based on the starting year used for the estimation period. This represents a swing of about 207 million bushels in the projection of U.S. soybeans production for 2020, by no means a trivial amount. The lowest trend yield projections are based on samples starting in the 1960s and the highest for samples starting in the 1990s. The higher trend yield estimates for samples starting in more recent years appears to be the result of a shift in the rate of growth in U.S. average soybean yields began after 2012. More recent samples better capture this shift. Trend estimates can also be made using a quadratic trend for longer samples. Either approach generates a trend yield projection for the U.S. average soybean yield in 2020 a bit above 50 bushels per acre. In future farmdoc daily articles, we will repeat this exercise using a crop weather model, which will allow us to directly estimate any bias inherent in unconditional trend regression models.
Source : illinois.edu