By Scott Irwin
The vast majority of domestic demand for ethanol in the U.S. is in the form of E10 gasoline blends. For example, implied domestic consumption of ethanol in 2018 was 14.4 billion gallons, of which all but a few hundred million gallons was in the form of E10. While there is much discussion (and controversy) about the potential for expansion of higher ethanol blends, such as E15 and E85, the bulk of domestic ethanol consumption in the future is likely to continue to be in the form of E10, as the evidence is clear that ethanol is a price competitive blending component in E10 (e.g., farmdoc daily,
April 4, 2019). Assuming gasoline blends remain near 10 percent ethanol, this means that growth in domestic ethanol use is directly tied to growth in the overall consumption of gasoline. The purpose of this article is to analyze recent trends in U.S. gasoline consumption and consider the implications for domestic ethanol use in the future.
Analysis
We follow this earlier farmdoc daily article (
June 10, 2016) and decompose total gasoline consumption into its two principal components in order to analyze recent trends. Specifically, we use the following relationship to understand the drivers of consumption:
Total gasoline consumption = Miles traveled / Miles per gallon.
In essence, gasoline consumption is equal to total miles traveled divided by average fuel efficiency of the vehicle fleet. Figure 1 shows the first component, total vehicle miles traveled (VMT) for the U.S. over 1990-2018. The VMT series is collected by the DOT and found
here and
here. Between 1990 and 2004, during the era of low and steady real crude oil prices, VMT grew at the remarkably steady pace of 60.5 billion miles per year (trend R2 = 0.998). The impact of rising real crude oil prices (and gasoline prices) is first seen in the diminished growth of VMT in 2005-2007 and then, combined with the impacts of the Great Recession of 2008-2009, an absolute decline to a low of 2,946 billion miles in 2011. From peak to trough, VMT fell 85 billion miles or 2.8 percent. The impact of the sharp decline in crude oil prices since 2014 is evident in the recovery of VMT above the 2007 peak to about 3,200 billion miles in 2017 and 2018. It is also important to note that the growth in VMT since 2014 was most rapid in 2015 and 2016. Very little growth, about 0.4 percent, was observed in 2018.
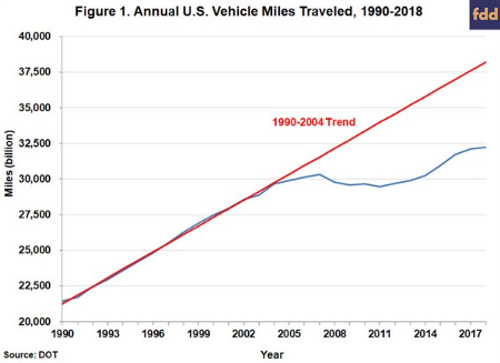
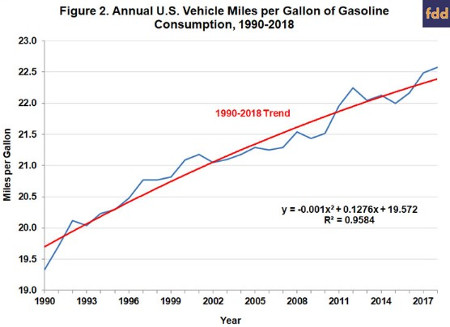
Figure 2 plots the second component of gasoline consumption, miles per gallon (MPG), over 1990-2018. It should be noted that the MPG series shown in Figure 2 is actually implied by dividing VMT by total gasoline consumption. This is because aggregate data for the U.S. is only available for VMT and total gasoline consumption. Computed in this manner, the fleet average MPG showed modest but steady gains of about 0.1 MPG from 1992 through 2010. Then, under the pressure of rising real crude oil prices and some policy incentives (“cash for clunkers”), U.S. consumers began buying more fuel efficient vehicles and MPG took a substantial jump, reaching a peak of 22.2 MPG in 2012. This was followed by a period of basically flat fuel efficiency through 2016 and then another jump to 22.5 MPG and higher in 2017 and 2018.
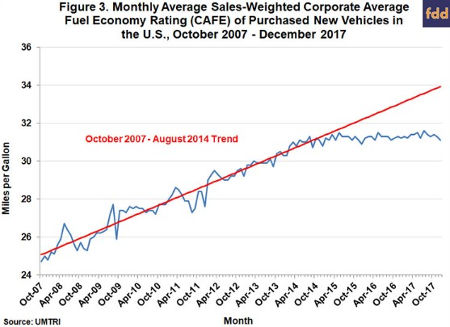
Additional perspective on fleet fuel efficiency is presented in Figure 3, which shows the monthly weighted-average fuel efficiency of new vehicle sales in the U.S. from October 2007 through December 2017, the latest available data from the Transportation Institute of the University of Michigan and available here. These data are interesting because they are based on detailed data on new cars and light-duty trucks purchased by U.S. drivers. Clearly, U.S. drivers responded to the dramatic fall in real crude oil prices that started in 2014 by not only driving more but also by shifting vehicle purchases towards less fuel efficient models. Figure 3 shows there was a sharp break in the weighted-average fuel efficiency of new vehicles starting in September 2014, when crude oil prices began their period of most rapid descent. This change in purchasing behavior has had a major impact on average new vehicle fuel efficiency. If U.S. drivers had continued on the same trend established over October 2007 through August 2014, the weighted average fuel efficiency in December 2017 would have been almost 33.9 MPG instead of 31.1 MPG.
For most of the period where the data in Figures 2 and 3 overlap, the trends are largely consistent. However, the last couple of years present a puzzle. The (implied) fleet average MPG ticked up in 2017 and 2018 despite the fact that the fuel efficiency of new vehicles was flat (assuming no gains in fuel efficiency for new vehicles in 2018). One explanation is that the fleet average MPG is noisy because it is implied based on data that is generated in two completely separate government surveys. The uptick in 2017-2018 may simply be statistical blip that will not be sustained based on this reasoning. The other explanation is that, for some reason, the older vehicles that are being scrapped from the fleet are less fuel efficient than the vehicles scrapped in earlier periods. While this is a logical possibility it does not seem very plausible. In sum, there is not an obvious explanation for the divergence in the two series the last couple of years.
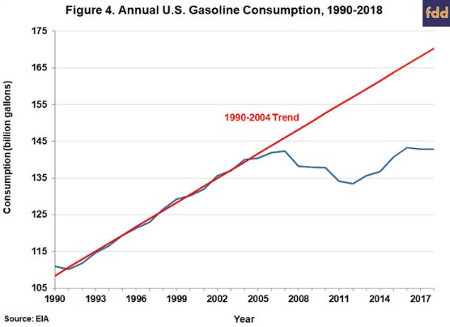
We can now move on to consideration of the data on total U.S. gasoline consumption found in Figure 4. The consumption series is collected by the EIA and found here (2018 was estimated based on monthly consumption data). Between 1990 and 2004, during the era of low and steady real crude oil prices, gasoline consumption grew at a steady pace of 2.2 billion gallons per year. Mirroring the impact on VMT, rising real crude oil prices (and gasoline prices) diminished the growth rate of gasoline consumption in 2005-2007 and then, combined with the impacts of the Great Recession of 2008-2009, went into a fairly steep absolute decline to a low of 133.4 billion gallons in 2012. From peak to trough, total consumption fell 8.2 billion gallons or 5.7 percent. Consumption steadily recovered over 2013 through 2016, with consumption in 2016 surpassing the previous peak in 2007. Total gasoline consumption declined slightly in 2017 and 2018, as gains in overall fleet fuel efficiency (Figure 2) outpaced modest gains in VMT (Figure 1).
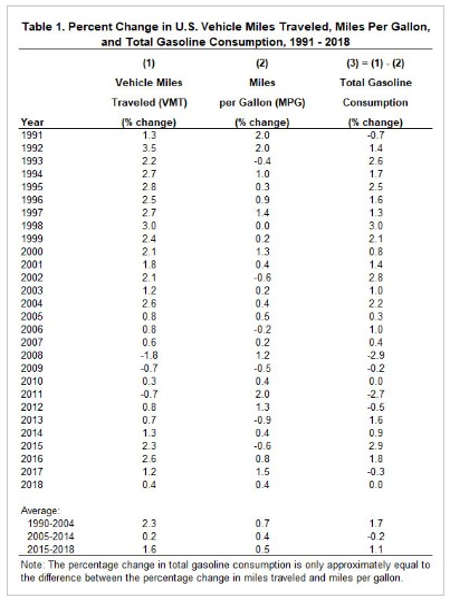
Further perspective on gasoline consumption and its components is presented in Table 1. Here, the annual percentage change for total gasoline consumption, VMT, and MPG are listed for each year between 1991 and 2018. Note that the percentage change in VMT minus the percentage change in MPG approximately equals the percentage change in total gasoline consumption. This means that if there is growth in miles traveled some of it may be offset by improvements in fuel efficiency (MPG), as was the case in 2017 and 2018. The averages reported at the bottom of Table 1 summarize the differences in economic behavior during 1990-2004, the period of low and stable real crude oil prices, compared to 2005-2014, when crude oil prices were high and volatile, and 2015-2018, a period of much lower crude prices. From 1990-2004, VMT grew at an annual average rate of 2.3 percent and MPG grew an average of 0.7 percent, for a net growth in gasoline consumption of 1.7 percent. The comparable averages for 2005-2014 are 0.2 percent for VMT, 0.4 percent for MPG, and -0.2 percent for consumption. It is interesting to observe that the growth rate of fuel efficiency was actually slightly higher over 1990-2004 compared to 2005-2014, despite the jump in efficiency that started in 2011 (Figure 2). The averages for 2015-2018 are 1.6 percent for VMT, 0.5 percent for MPG, and 1.1 percent for consumption. It is interesting to observe that MPG varied relatively little compared to VMT, indicating that variation in total gasoline consumption over the long-run has been most closely related to variation in VMT.
Looking forward from the perspective of ethanol demand, the most concerning result of this analysis is the flattening of growth in gasoline consumption since 2017. This is especially concerning in light of how low real crude oil and gasoline prices have been in the last two years. Figures 5 and 6 show the real annual average spot prices of WTI crude oil over 1990-2018 and the real annual average retail price of gasoline in the U.S. (all grades), respectively. The crude oil and gasoline price series are collected by the EIA and found here. Real prices are computed by dividing nominal prices by the U.S. Consumer Price Index (CPI) for all urban consumers, which can be found here and here. The base for the CPI is 1982-1984=100, which means that computed real prices are stated in terms of average prices over the 1982-1984 period. Another way of saying the same thing is that prices are adjusted to a constant purchasing power in terms of 1982-1984 dollars. It is important to note that a different base period will result in different computed real prices.
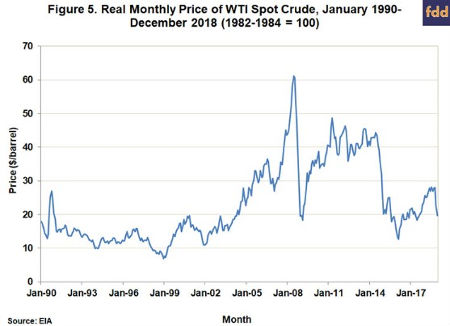
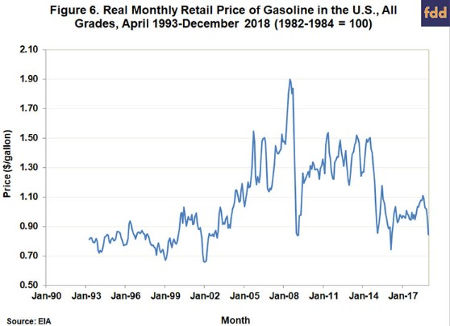
As shown in Figure 5, real crude oil prices fluctuated in a relatively narrow range from about $10 to $20 per barrel over 1990 through 2004. From this point forward, the real price of crude rose spectacularly, reaching a peak of $61 in 2008. The Great Recession of 2008-2009 saw the real price fall back to $20, snap back quickly during 2010, and then trade in a range of about $40 to $50 over 2011 through 2014. Since then, real crude prices have fluctuated between about $20 and $30, with prices spending most of the time around $20. Figure 6 shows the real price of gasoline in the U.S., and not surprisingly, the pattern is very similar to that of crude oil. The key takeaway is that real gasoline prices in the last two years have averaged $1 per gallon, pretty much the same level of real prices as in the late 1990s and early 2000s.
The implication of the data on real crude oil and gasoline prices is that the underlying fundamentals are strong for growth in U.S. gasoline consumption. In addition to low real prices, U.S. economic growth the last two years has been the strongest in the last decade. The flatlining of U.S. gasoline consumption the last two years suggests other factors are offsetting the positive impact provided by low real gasoline prices and strong economic growth. There is no conclusive single answer but a variety of factors have been suggested: i) increasing Federal CAFE fuel efficiency standards, ii) the explosion in the growth of ride-sharing such as Uber and Lyft, iii) the impact of social media, especially on young drivers, and iv) growth in the use of electrical vehicles. Regardless of the correct explanation, it may be the case that the flatlining of U.S. gasoline consumption in 2017 and 2018 is an early warning sign of a long-term systemic decline in gasoline demand that is just beginning. As shown in Figure 7, this is built into the latest AEO long-term projections of U.S. gasoline consumption from EIA, which turn down sharply starting in 2020. By 2030, the EIA baseline projection of gasoline consumption is only 116.9 billion gallons, a decline of 26.1 billion gallons or 18.2 percent from the current projection of consumption in 2019.
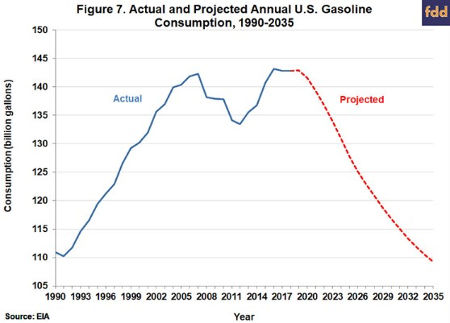
There is obviously a great deal of uncertainty in projecting U.S. gasoline consumption out a decade or more. As just one example, the current EIA baseline projections do not incorporate the freezing of CAFE fuel efficiency standards the Trump Administration is in the process of rolling out (Davenport, 2019). However, this could in theory be offset by faster than expected adoption of electrical vehicles. Regardless of one’s position on these individual factors, the message from the EIA projections in Figure 7 is that U.S. gasoline consumption is highly unlikely to grow in the future and is much more likely to decline. Having reached “peak gasoline consumption,” the real question becomes the rate of decline. This, of course, has momentous implications for domestic U.S. ethanol consumption assuming it continues to be tied to E10 blends. The EIA projection of gasoline consumption in 2030 of 116.9 billion gallons implies an E10 blend wall of only 11.7 billion gallons. This can be compared to the 2019 projection of 142.9 billion gallons for gasoline consumption which implies an E10 blend wall of 14.3 billion gallons. The projected decline in the E10 blend wall of 2.6 billion gallons represents approximately 930 million bushels of lost corn demand (not considering the offset of lost DDGS production on feed demand).
Implications
With the vast majority of U.S. domestic demand for ethanol in the form of E10 gasoline blends, growth in domestic ethanol use is tied directly to growth in the overall consumption of gasoline. This article analyzed recent trends in U.S. gasoline consumption with an eye towards the implications for domestic ethanol use in the future. The data show that U.S. gasoline consumption grew 1.7 percent per year from 1990-2004, dipped to -0.2 percent per year from 2005-2014, and then recovered back to 1.1 percent per year in 2015-2018. However, the 2015-2018 average obscures the fact gasoline consumption was basically flat the last two years, which is a puzzle because the underlying economic fundamentals have been strong for growth in U.S. gasoline consumption. This is especially concerning because the flatlining of U.S. gasoline consumption in 2017 and 2018 may be an early warning sign of a long-term systemic decline in gasoline demand that is just beginning. Long-term projections from the EIA incorporate this assumption and show a substantial drop in U.S. gasoline consumption over the next decade. This, of course, has momentous implications for domestic U.S. ethanol consumption assuming it continues to be tied to E10 blends. For example, the EIA projections imply a 2.6 billion gallon decline in the E10 blend wall by 2030. It is surely, then, no surprise why the U.S. ethanol industry is pushing so hard for expansion in the use of E15, which may be required for the industry to just stay even in total domestic consumption of ethanol. It also portends an intensification of the political battle over the RFS as the U.S. gasoline market shrinks.