By Gary Schnitkey and Nick Paulson et.al
Department of Agricultural and Consumer Economics
University of Illinois
By Carl Zulauf
Department of Agricultural, Environmental and Development Economics
Ohio State University
We provide payment examples for Enhanced Coverage Option (ECO) to aid in understanding of the new crop insurance option. We also show 2021 expected county yields for corn and soybeans in Illinois. This article continues a series of articles on ECO. Previous articles described ECO , evaluated the size of premiums , gave historical frequencies of payments (farmdoc daily, December 10, 2020), and illustrated years in which ECO made payments.
ECO for Revenue Protection
To be eligible to purchase ECO, a producer is required to buy an underlying individual plan of insurance that is part of the COMBO product. The COMBO product includes Revenue Protection (RP), RP with harvest price exclusion, and Yield Protection. ECO coverage mimics that of the underlying COMBO product. Examples presented here will be shown for ECO combined with RP since the majority of polices in the Midwest are RP (farmdoc daily, November 17, 2020).
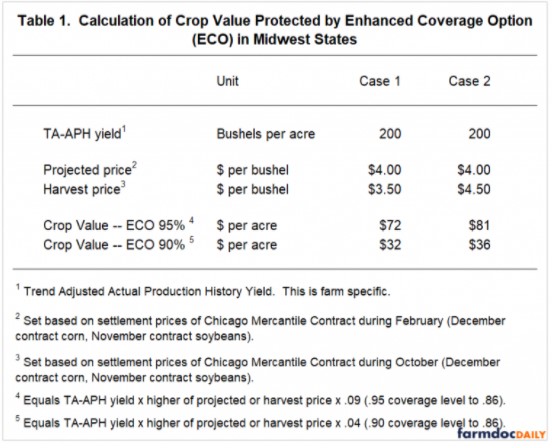
Crop Value Protected by ECO
ECO will protect a range from either 95% or 90% down to 86%. Farmers have a choice of either 95% or 90% coverage levels. For 95% coverage levels, ECO protects 9% of crop value, conceptually the range from 95% to 86%. ECO at 90% provides a protection range of 4% (90% coverage level down to the 86% ending level).
The crop value protected by ECO will be related to the yield used to set RP guarantees, which in most cases is the Trend Adjusted Actual Production History (TA-APH) yield. The TA-APH yield is farm-specific, depending on an up to ten-year history of yields from a farm or unit. Since TA-APH will vary from farm to farm, crop values protected by ECO will also vary. Farms with higher TA-APH yields will have higher crop values, and vice versa.
Table 1 shows the calculation of crop values under ECO at 95% and 90% coverage levels. As an example, the farm has a 200 bushel per acre TA-APH yield, and the projected price is $4.00 per bushel. Case 1 in Table 1 illustrates the crop value when the harvest price is less than the projected price. Under case 1, the crop value under ECO 95% is $72 per acre (200 TA-APH x $4.00 projected price x .09). The crop value for ECO 90% is $32 per acre (200 TA-APH x $4.00 projected price x .04).
Because RP uses the higher of the projected and harvest prices in setting guarantees, so will ECO when RP is the underlying product. As a result, crop value increases when the harvest price is above the projected price. Under case 2 in Table 1, the harvest price is at $4.50, which is $.50 above the projected price. The crop values are now higher at $81 per acre for ECO 95% and $36 per acre for ECO 90%.
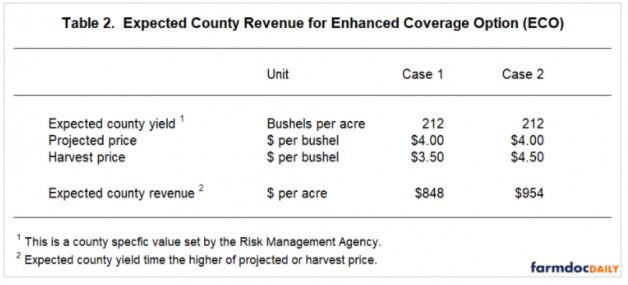
Expected County Revenue
Each county will have an expected county revenue that equals the expected county yield times the higher of projected or harvest prices. Expected county yields are calculated by the Risk Management Agency (RMA), with Figure 1 showing 2021 values for non-irrigated corn in Illinois. McLean County has a 212 bushel per acre expected yield for 2021.
Because RP uses the higher of the projected and harvest prices in setting guarantees, so will ECO when RP is the underlying product. As a result, crop value increases when the harvest price is above the projected price. Under case 2 in Table 1, the harvest price is at $4.50, which is $.50 above the projected price. The crop values are now higher at $81 per acre for ECO 95% and $36 per acre for ECO 90%.
Expected County Revenue
Each county will have an expected county revenue that equals the expected county yield times the higher of projected or harvest prices. Expected county yields are calculated by the Risk Management Agency (RMA), with Figure 1 showing 2021 values for non-irrigated corn in Illinois. McLean County has a 212 bushel per acre expected yield for 2021.
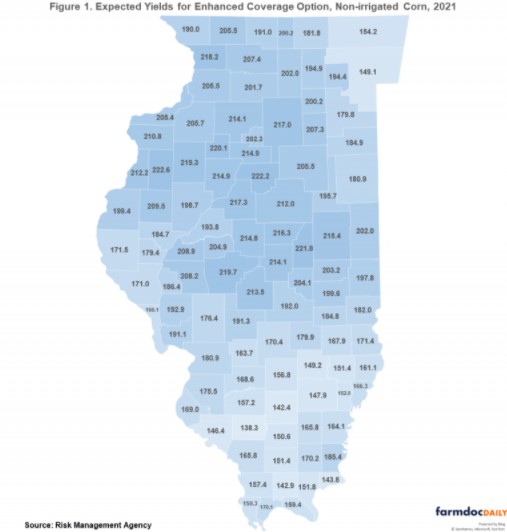
Table 2 shows expected county revenues using the 212 bushel per acre McLean County yield. Case 1 shows expected county revenue when the harvest price is below the projected price. The $848 per acre expected county revenue for case 1 equals the 212 expected county yield times the $4.00 projected price. Under case 2, the $4.50 harvest price is higher than the projected price, and the expected county revenue of $954 per acre equals the 212 expected yield times the $4.50 harvest price.
Payment Examples for ECO 95%
Payment examples for ECO 95% are shown in Table 3. The first three cases use a yield of 205 bushels per acre, while the fourth example uses a yield of 180 bushels per acre. Actual county yields will be calculated from farm-level yields reported to RMA. Actual county yields will be released in June of the year following production. For example, actual 2021 yields will be reported in June 2022. As a result, ECO payments, if any, will not be received until the summer after production. The actual county yield is multiplied by the harvest price to arrive at county revenue. A 205 bushel per acre actual county yield and a $3.95 harvest price results in county revenue of $810 per acre (first column of Table 3).
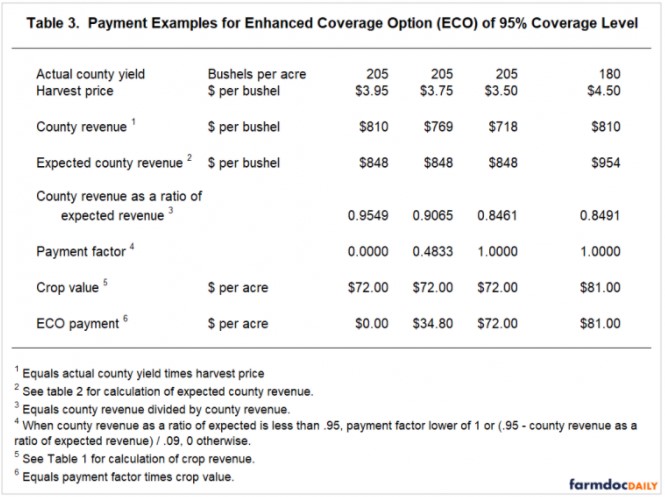
The county revenue is then divided by expected county revenue (see Table 2) to arrive at “county revenue as a ratio of expected revenue”. This ratio is compared to the ECO coverage level of .95. If actual revenue as a ratio of expected revenue is below .95, an ECO 95% coverage level policy will make a payment. The payment will then equal crop value times a payment factor.
When the percentage is below .95, a payment factor for ECO 95% is equal to
(.95 – county revenue as a ratio of expected revenue) / .09
where the payment factor cannot exceed 1.0. The .09 represents the full range of coverage under ECO 95%. If actual revenue as a percent of expected revenue is .94, then there is a .01 margin below the .95 coverage level. This .01 is divided by .09 to arrive at the payment factor. When the actual revenue as a ratio of expected revenue is below .86, all of the crop value protected by ECO will be paid, and the payment factor will equal 1.0000.
The first three columns of Table 3 show three different payment factors for ECO 95%.
- A 205 bushel per acre county yield and a $3.95 harvest price results in a .9549 county revenue as a ratio of expected revenue. The .9549 is above the .95 coverage level, and no payment occurs.
- A 205 bushel per acre county yield and a $3.75 harvest price results in a .9065 county revenue as a ratio of expected revenue. The .9065 triggers a payment and has a payment factor of .4833.
- A 205 bushel per acre county yield and a $3.50 harvest price has a .8461 county revenue as a ratio of expected revenue. The .8461 is below the .86 ending coverage of ECO. The payment factor is 1.0, meaning that the maximum payment is made.
The payment factor is multiplied by the crop value (see Table 1) to arrive at the ECO payment. The ECO payments for the first three cases are:
- A $0 per acre payment results under a 205 bushel per acre county yield and a $3.95 harvest price. County revenue as a ratio of expected revenue is above the .95 coverage level, resulting in no ECO payment.
- A $34.80 per acre payment results for a 205 bushel per acre county yield and a $3.75 harvest price. The payment factor of .4833 is multiplied by a $72 crop value to arrive at the ECO payment.
- A $72.00 per acre payment results for a 205 bushel per acre county yield and a $3.50 harvest price. The $718 county revenue results in a 1.000 payment factor because county revenue as a ratio of expected revenue is .8461, below the .86 ending coverage protected by ECO.
The final column of Table 3 shows the case when the harvest price is above the projected price. In this case, the expected crop revenue is $954, an increase from the $848 in the other cases. Expected crop revenue uses the harvest price in its calculations when the harvest price is above the projected price (see Table 2). The crop value has increased to $81 per acre, which equals the 200 TA-APH yield x the $4.50 harvest price (see Table 1).
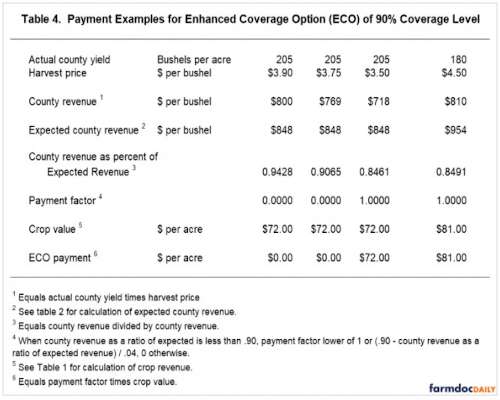
Payment Examples for ECO 90%
Table 4 shows ECO payments for the 90% coverage level. County revenue as a ratio of expected revenue is now compared to 90% rather than 95%. The payment factor is now .04, the range from .90 to .86.
Expected County Yields for Soybeans
Figure 2 shows the expected county yields for soybeans. As with the case of corn, these yields are released by RMA.
Summary
We show payment examples to aid in understanding how ECO operates. ECO payments will be triggered based on county revenue, not farm revenue. Payment amounts will then be based on crop values, which will vary from farm to farm.
Some farmers who want additional protection at coverage levels above those offered by RP may find ECO useful. As illustrated in previous articles, this coverage will come at relatively high premium levels, particularly for the 95% coverage level. However, ECO will make payments relatively frequently.
Source : illinois.edu