By Gerald Mashange and Bradley Zwilling
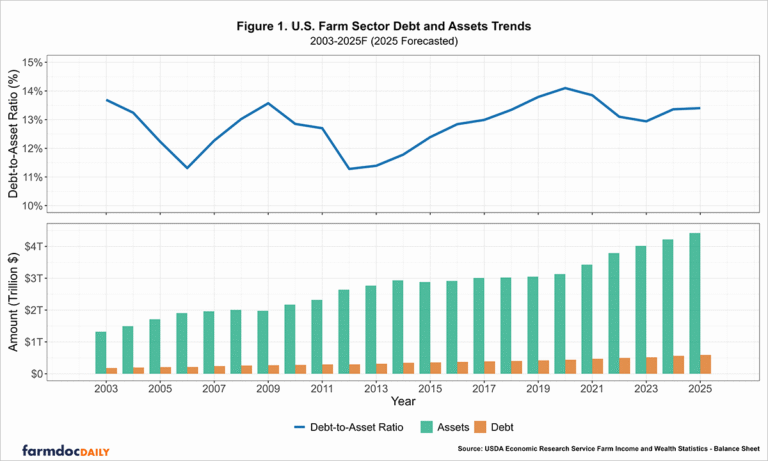
U.S. farm sector debt is projected to climb to $591.8 billion in 2025, up 5.0% from 2024, while farm sector assets are expected to increase by 4.7% to $4.42 trillion, according to the USDA’s Economic Research Service (see Farm Sector and Wealth Statistics). This translates to a debt-to-asset ratio of 13.40% in 2025 for the sector, slightly higher than 13.36% in 2024. However, the debt-to-asset ratio for the sector has remained relatively stable over the past two decades. Since 2003, farm sector debt has risen by 226.80% from $181.1 billion and assets by 234.03% from $1.32 trillion. And yet, over this period, the debt-to-asset ratio has remained within a narrow range of 11.28% to 14.1%, as shown in Figure 1 below.
Last week, the Federal Open Markets Committee (FOMC) lowered the federal funds rate by 25 basis points, setting a new target range of 4.00% to 4.25%. Despite the welcome relief for borrowers, we are still in a high-interest rate environment. Interest rates dramatically rose from near zero in March of 2022 to a peak target rate of 5.25% to 5.50% in July 2023. Many farmers have experienced higher borrowing costs as a result. Chapter 12 farm bankruptcies rose by 55% (216 filings) in 2024 compared to the previous year and are expected to trend higher this year (see Bloomberg Law, April 2025). Even so, the 2024 figure is well below the 595 filings reported in 2019 that occurred during the Trump administration’s trade war with China (see Farm Bureau Market Intel, January 2020).
Given the elevated borrowing costs farmers have faced in recent years, it is timely to examine how producers are faring financially. In today’s farmdoc daily article, we begin our series by exploring the solvency of grain farms in Illinois using data from the Farm Business Farm Management (FBFM). While the U.S farm sector figures discussed earlier would include all farm types that have a minimum of $1,000 in gross revenue, the FBFM data used in this article are from operating grain farms that have a much higher gross revenue.
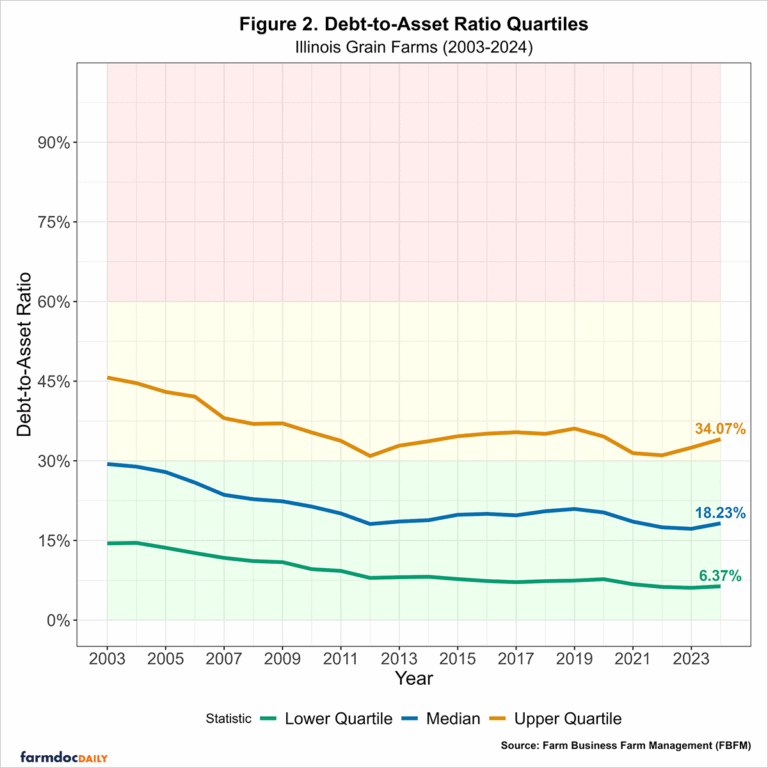
The debt-to-asset ratio measures farm solvency by showing the share of assets financed by debt instead of equity. Therefore, a higher ratio indicates that a greater share of the farm’s assets is financed with debt. Lenders use this ratio to evaluate a farm’s ability to meet its long-term financial obligations. According to the Center for Farm Financial Management’s Farm Financial Scorecard, a farm with a debt-to-asset ratio above 60% is categorized as vulnerable, between 30% and 60% is categorized as cautionary, and a ratio below 30% is categorized as strong. shows how the ratio has varied across Illinois grain farms from 2023 to 2024, reported at the lower quartile, median, and upper quartile levels. Quartiles divide farms into four equal groups, and each measure provides a different perspective on the distribution of debt-to-asset ratios. The lower quartile marks the debt-to-asset ratio below which 25% of farms fall these are the farms with the strongest solvency (lowest leverage). The median is the middle value, where half the farms have lower ratios (stronger solvency) and half have higher ones (weaker solvency). The upper quartile marks the ratio below which 75% of farms fall, meaning the top 25% of farms the most highly leveraged ones have even higher ratios above this point. We also use the color-coding system from the Farm Financial Scorecard to indicate the risk category the ratio falls under in a given year. The region shaded in red indicates a vulnerable ratio, yellow represents a cautionary ratio, and green indicates a strong ratio.
Source : illinois.edu