By Bradley Zwilling
Illinois FBFM Association and Department of Agricultural and Consumer Economics
University of Illinois
With tightening margins and greater amounts of uncertainty, producers are looking for ways to cut costs. In this article, we will look at power and equipment costs components, how they vary by farm size and the impact on profitability.
In 2003, Illinois Farm Business Farm Management (FBFM) changed depreciation methods. Before 2003, tax depreciation was used to determine machinery depreciation. Because tax law now allows large write-offs in the year of purchase, economic depreciation was adopted in 2003. Depreciation of most farm machinery is determined using a ten-year 125% declining balance with a salvage value of $0. Bonus depreciation or expense elections claimed for tax purposes are not included in economic depreciation.
Summaries of FBFM records indicate that power and equipment costs on Illinois grain farms average $146.30 per tillable acre in 2019. Power and equipment costs are composed of utilities ($7.08), machinery repairs ($32.03), machine hire and leases ($19.87), fuel and oil ($20.24), light vehicle ($2.09) and machinery economic depreciation ($65.00). This total cost compares to 2010 when the total power and equipment cost per acre was $108.63. Figure 1 shows the breakout of the parts of power and equipment costs from 2005 to 2019 per tillable acre.
In Figure 1, we see that in 2008 economic machinery depreciation began to accelerate more than the other components of power and equipment costs. The acceleration was due to increased incomes as well as increased expense election limits for tax purposes. Farmers were purchasing equipment to utilize the expense election to have current tax deductions. Since 2014, economic depreciation has lowered off as less annual capital purchases were being made. Also in 2014, fuel and oil costs decreased and have maintained that lower level for the last five years.
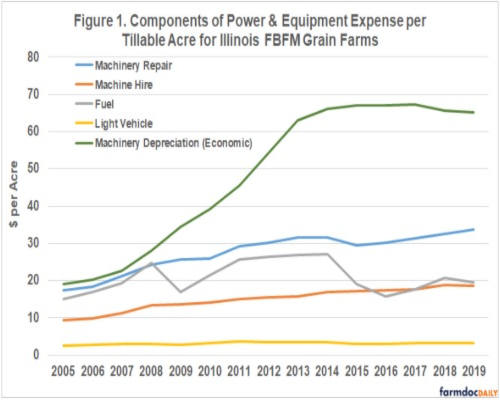
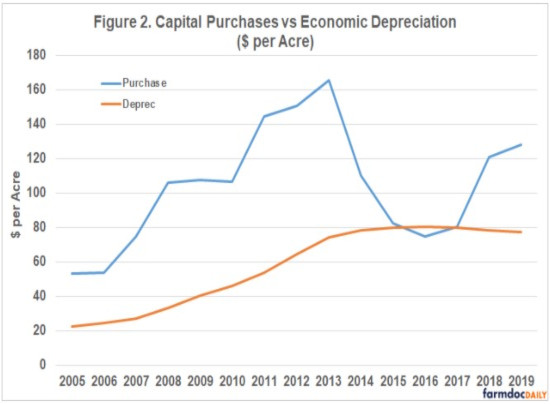
Figure 2 shows average capital purchases per acre for Illinois grain farms from 2005 to 2019 compared to total economic depreciation. Capital purchases began to increase in 2006 with the run-up in grain prices. This trend continued through 2013, and capital purchases have been decreasing on a per acre basis until 2016. Starting in 2018, FBFM has shown the full purchase price of equipment and then offsets this transaction with the sale of any assets traded in to acquire the purchase. Prior to that, FBFM would show the net amount paid as a capital purchase. Figure 2 shows the full price per acre of the purchased item for 2018 and 2019. If you were to net capital purchases against sales in 2019, the result would have been about $70 to $75 per acre.
Farm Size and Power Costs
Average power and equipment costs by farm size is displayed in Table 1 for 5 periods in time. Power and equipment costs averaged higher for the smallest and the largest farm sizes. Average power and equipment costs do not show a trend for size categories in the middle ranges. In 2019, the lowest average power and equipment cost was $134 per acre for farms between 2,001 and 3,000 acres. The highest cost was $168 for farms with 500 or fewer acres.
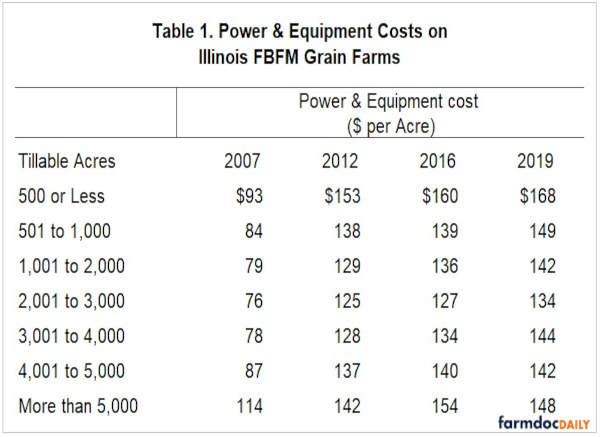
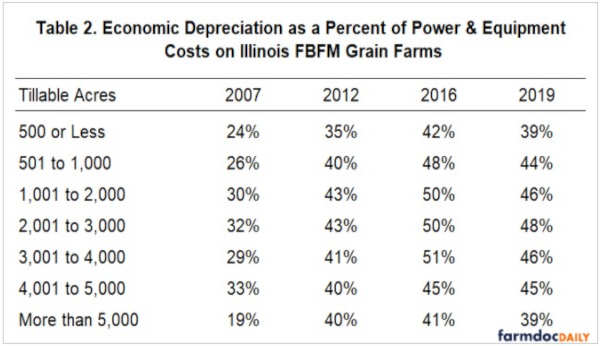
Table 2 shows economic machinery depreciation as a percent of total power and equipment costs by farm size. As you can see, there is not much difference in the percent of economic machinery depreciation by farm size. However, the percent has increased on average about 10% every five years since 2007 until 2019 where it has begun to decrease. The average economic depreciation as a percent of total power and equipment costs was 29% in 2007, 41% in 2012, 48% in 2016, and 44% in 2019. It is interesting to note that size groups with the largest power and equipment costs had the lowest percent of that cost from economic depreciation and vice versa.
Power Costs and Profitability
Lower power and equipment costs tend to lead to higher profitability. For this study, profitability is measured by per acre management returns. Management returns equal revenue minus economic expenses, with economic expenses including costs for unpaid labor and equity capital invested in the operation. Table 3 shows management returns by ranges of power and equipment cost for different points in time.
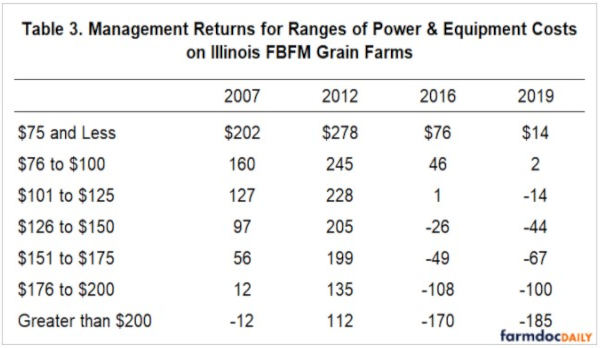
In 2019, farms that had power and equipment costs of $75 and less per tillable acre averaged management returns of $14 per acre. As power and equipment costs increased, average management returns decreased. For power and equipment cost categories between $76 and $100 per acre, management returns were $2 per acre. For farms with power and equipment costs above $200 per acre, management returns averaged a negative $185 per acre.
In general, a strong link exists between power and equipment costs and management returns. Farms that have lower power and equipment costs tend to have higher profits. Controlling costs, including power and equipment costs, is a key in increasing farm profitability.
Summary
Power and equipment costs on Illinois FBFM grain farms increased quickly during the run-up in grain prices in the mid-2000’s. The main driver was economic machinery depreciation because of increased capital purchases. Most machinery is depreciated over 10 years for economic depreciation. We have begun to see economic depreciation begin to level off as capital purchased decreased from 2013 to 2017. There is a strong connection between power and equipment costs and profitability because as power and equipment costs decrease, profitability tends to increase. Therefore, power and equipment costs are worth looking into when trying to cut costs. However, in 2019, 44% of this cost was due to economic machinery depreciation, which will be slow to change thus large cuts will need to be made to the other components of power and equipment costs to make a more current impact on costs.
The author would like to acknowledge that data used in this study comes from the local Farm Business Farm Management (FBFM) Associations across the State of Illinois. Without their cooperation, information as comprehensive and accurate as this would not be available for educational purposes. FBFM, which consists of 5,500 plus farmers and 65 professional field staff, is a not-for-profit organization available to all farm operators in Illinois. FBFM field staff provide on-farm counsel with computerized recordkeeping, farm financial management, business entity planning and income tax management. For more information, please contact the State FBFM Office located at the University of Illinois Department of Agricultural and Consumer Economics at 217-333-8346 or visit the FBFM website at www.fbfm.org.
Source : illinois.edu