By Ryan Bergman
As harvest starts to ramp up across Iowa, many people will be evaluating their crop scouting activities from 2021 and starting to make plans for 2022. In a previous article, we outlined options for capturing imagery of your fields to aid in scouting and making management decisions. Fall can be a great time to capture imagery to understand crop dry down, late season weed pressure and crop lodging. As you consider remaining imagery needs for 2021 and make plans for 2022, there are three characteristics of imagery you should understand:
- Image Resolution
- Image Timing
- Image Type or Spectral Bands Captures
Image Resolution
Image resolution is the measure of the land area represented in a single pixel of your image. An image for a low-altitude UAV flight might be around 1 square inch per pixel, while a satellite image may be 6 square feet per pixel. With both UAVs and manned aircraft, resolution depends on the camera used and the flight altitude. Flying lower will increase resolution, but will also increase flight time and require a number of passes across the field to complete a map.

Figure 1. At this mid-range level of resolution of 20 inches in the top image, it’s possible to pick out row to row variation, but stand counts would still not be possible. At the 2-inch resolution on the bottom, it’s possible to see individual plant leaves later in the season and would provide the ability to do stand counts earlier in the season.
The level of resolution you need depends on your intended use for the imagery. To simply document drainage issues and ponding, satellite imagery may be suitable. However, if you’re looking to conduct plant stand counts or assess emergence issues, higher resolution images (likely from a UAV) will be necessary.
Image Timing
Timing your imagery capture with the weather is key to getting high quality images. However, it’s just as important to consider the growth stage of your crop when deciding when to conduct a flight. Flying too early in the season when not much plant growth has been established above the soil can result in an image that shows mostly soil. Flying too late can often hinder your ability to identify issues with planting, emergence and early season development. Figures 2, 3, 4, and 5 show aerial images taken of the same field several weeks apart. Note: These images are from 2019, which came with a wet spring and delayed planting in this field. The amount of soil visible in these images is not likely to be seen in June in an average year.
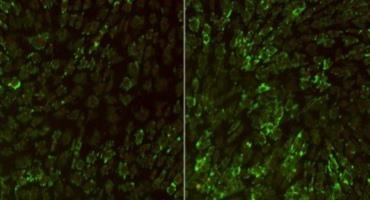
Figure 2. This image was likely taken too early to assess crop emergence and vigor differences. This early imagery can be beneficial to understand water flow and pothole areas of a field. Some users have been able to map tile lines off this type of early imagery when the fields are saturated by spring rain.
Figure 3. Crop growth at this point is far enough along to see visual differences in crop color and vigor across the field. The impact of soil compaction from spring equipment passes is visible around many of the drowned-out areas of the field. Headland traffic from in-season sidedressing and spraying is also very visible.

Figure 4. By this point of the season the crop is far enough developed many of the early season crop vigor differences are difficult to detect. However, an area of tile work in the lower left area of the field is very evident in this image. Some compaction from traffic is visible across the field, but more difficult to see the impact of individual tires on a row.
Figure 5. Later season imagery can be useful for assessing variability in crop dry down. Some areas in this image are starting to dry down (center area of the image). Drowned out areas are still green with weeds at this stage. Some areas of around the tile work and drown out areas still appear yellow due to reduced crop vigor.
Image Type or Spectral Bands Captures
A popular image type for assessing fields is a NDVI (normalized difference vegetative index). NDVI utilizes an NIR (near infrared) image to generate the NDVI map. Time images shown in Figure 6 display the raw NIR image on top and the resulting NDVI image on the bottom. The near-infrared light bands can often display different characteristics than traditional RGB color images. The NDVI map highlights these differences by displaying them with varying colors.
Figure 6. A comparison of the same field captured using NIR and NDVI imagery.
Other indexes are also available and require different inputs in terms of light wavelength recorded by the camera. A VARI (visible atmospherically resistant index) will often look similar to NDVI, but uses an RGB photo input and emphasizes different crop characteristics.
Figure 7. A comparison of the same field captured using RGB and VARI imagery.
These indexes often look and are viewed similarly to a combine yield map. It’s important to understand the color variations and how they were assigned to show differences in crop vigor. Indexes are a way to categorize and differentiate data points to make differences easier to identify. These indexes often may display areas of lower or higher yield, but perceived poorer areas of a field in an image may still yield as well as other areas. The image doesn’t always predict a yield difference.
When deciding to include aerial imagery as part of your management plan, it’s important to understand not only the process of capturing images, but the options and adjustments that will affect the quality of your image. Take time to evaluate your crop scouting needs and take these characteristics into account before heading to the field or scheduling a flight.
Source : iastate.edu