By Carl Zulauf
Department of Agricultural, Environmental and Development Economics
Ohio State University
and
Gary Schnitkey, Krista Swanson, Jonathan Coppess, and Nick Paulson
Department of Agricultural and Consumer Economics
University of Illinois
The Agriculture Improvement Act of 2018 (2018 farm bill) gives FSA (Farm Service Agency) farm owners a 1-time option to update PLC (Price Loss Coverage) payment yields. Of 21 program commodities, only corn, soybeans, upland cotton, and, especially sorghum have a US national PLC yield that is higher with the 2018 than the 2014 farm bill update formula. This outcome reflects (a) features of the yield update formula specified by Congress and (b) yield-affecting events during the respective update periods of 2013-2017 and 2008-2012. Prior farmdoc daily articles of
1/17/2019 and
2/7/2019 have examined the important impact of crop rotation on PLC update yield.
2018 Farm Bill Update Yield
The 2018 farm bill specifies the following PLC yield update formula:
(90% times average 2013-2017 yield of a covered commodity on a FSA farm)
times
(average US 2008-2012 yield divided by average US 2013-2017 yield of the covered commodity)
Yields are per planted acre. The US yield ratio (2nd term in formula) cannot be less than 0.90 nor more than 1.00. If all other factors are the same, the update formula implies an FSA farm will benefit from the update if its average yield increased more than US average yield from 2008-2012 to 2013-2017.
Rationally, an owner will decide to update PLC yield only if the update yield generated by the formula above exceeds the existing PLC yield. This decision rule framed all previous updates, including the 2014 farm bill update. The 2014 yield update formula was:
(90% times average 2008-2012 yield per planted acre of a covered commodity on a FSA farm)
Data and Procedures
Examining PLC yields at the national market level, US yield per planted acre is computed for each year from 2008 to 2017 for each program commodity using data from
QuickStats (US Department of Agriculture). The 2014 and 2018 US update yields are calculated using the formulas in the preceding section. The 2 yields are compared, in essence, assuming the 2014 update yield is the existing PLC yield. See Data Note 1 for additional discussion of the procedures.
US Yield Ratio
The US yield ratio in the 2018 update formula varies from 0.82 for sorghum to 1.15 for rapeseed (see Figure 1). The ratio lies outside the 0.90 and 1.00 legislative limits for 38% of the 21 program commodities in this study. Sorghum, soybeans, corn, and upland cotton are below 0.90. Rapeseed, large chickpeas, safflower, lentils, and wheat are above 1.00.
US Formula Yield
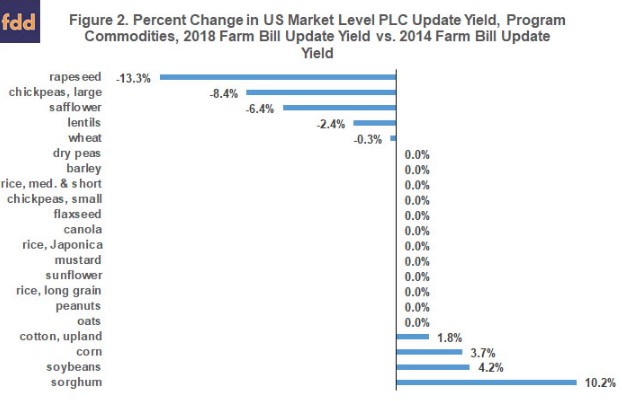
When the 2018 farm bill update yield is calculated at the US market level, US yield is the farm yield in the 2018 update formula. Thus, (90% times US average 2013-2017 yield) appears in both the numerator and denominator of the 2018 update formula, canceling itself out. Hence, assuming no constraints, for US yield the 2018 yield update formula simplifies to (90% of average US 2008-2012 yield), which is the 2014 farm bill update formula. This simplification is why the US yield ratio can be thought of as a yield deflator. The 0.90 constraint materially alters the formula. Crops with a US yield ratio below 0.90 have a higher 2018 than 2014 update yield since 0.90 is higher than their US yield ratio (see Figure 2). In contrast, rapeseed, large chickpeas, safflower, lentils, and wheat have a lower 2018 than 2014 US update yield because the 1.00 constraint results in their 2018 update yield becoming their lower 2013-2017 average yield (see Figure 2). For the other 12 program commodities, the 2018 and 2014 update US yields are the same as their US yield ratio exactly offsets the increase in their average US yield from 2008-2012 to 2013-2017 (see Figure 2).
Yield-Affecting Events
The House of Representatives initiated discussion of a PLC yield update by permitting an update in any area that had a D4 (exceptional) drought in the US Drought Monitor for at least 20 consecutive weeks in calendar years 2008-2012 (farmdoc daily,
10/2/2018 and
1/17/2019). The yield update formula contained in the enacted 2018 farm bill may also generate higher 2018 than 2014 update yields for crops that had (a) a low US average 2008-2012 yield for reasons other than drought, or (b) a high US average 2013-2017 yield. To further explore this point, regression analysis is used to estimate a linear yield trend for crop years 1993-2017. This is the longest period of data for all program commodities except large and small chickpeas. For these 2 crops, a linear trend is estimated using their available data (2003-2017). Percent deviation of a year’s yield from its linear trend is calculated. Average percent deviation is then calculated for the 2008-2012 and 2013-2017 update windows. See Data Notes 2-4 for further discussion of this analysis.
For 8 of the 42 update window observations (19%), actual yield deviates from trend yield on average by more than 5%, ranging from -8.8% for sorghum to +19.4% for rapeseed, both occurring in 2008-2012 (see Figure 3). All 4 crops with a higher 2018 than 2014 US update yield had average yields below trend in 2008-2012. Sorghum, soybeans, and corn also had average yields above trend in 2013-2017. Upland cotton had average yield below trend in both update windows, but especially 2008-2012. Interestingly, oats and mustard do not have a higher 2018 than 2014 update yield despite having trend yield deviations comparable to the 4 crops with higher 2018 update yields. It is not clear why this situation exists, but it is probably related to the estimation of trend yield.
Summary Observations
- At the US market level, corn, soybeans, upland cotton, and, especially sorghum, have a higher 2018 than 2014 PLC update yield. The other 17 program commodities in this study have a 2018 update yield that is the same or lower than their 2014 update yield.
- Corn, sorghum, soybeans, and upland cotton accounted for 68% of base acres at the time of the 2014 farm bill sign up (generic base acres are used for upland cotton base acres).
- Since a large share of base acres potentially can benefit from the 2018 update and since a higher PLC payment yield unambiguously increases PLC payments, the 2018 farm bill PLC yield update option could materially increase federal outlays if PLC is elected for most base acres, as is currently expected, and if PLC payment rates per unit of program commodity are non-trivial.
- The higher 2018 than 2014 US yield update for corn, soybeans, upland cotton, and sorghum depends on the 0.90 constraint in the 2018 update formula. The 0.90 constraint also means PLC update yield increases less than did average yields from 2008-2012 to 2013-2017. Thus, PLC yield for these 4 crops increase less with the type of update formula in the 2018 farm bill than the type of update formula in the 2014 farm bill.
- A higher 2018 than 2014 yield update also depends on yield-affecting events during the 2014 and 2018 update windows of 2008-2012 and 2013-2017, respectively.
- The 2018 farm bill yield update allows crops and farms with above trend yields in 2008-2012 the option to keep their high 2008-2012 yields. Rapeseed and large chickpeas especially fall into this category of gainers from recent PLC yield updates.
- Discussion of a 2018 farm bill yield update was initiated to address the negative impact of drought on 2014 farm bill update yields. The enacted 2018 update formula likely achieves this goal in general. It also may increase PLC yields for farms and crops that (a) had yields below trend in 2008-2012 for reasons other than drought and (b) had yields above trend in 2013-2017.
- Yield-affecting events raise commodity policy issues. Is it fair and is it good policy that PLC payments, determined in part by random luck associated with historic weather, will help determine the relative prosperity of farms over the next 5 crop years and may even determine who survives if a period of severe financial stress occurs? Should a policy priority be identification of the yield update method that minimizes the role of historic yield-affecting random luck, both good and bad, on future program payments?
- This analysis prompts the specific policy question of whether trend-adjustment, which the 2018 farm bill extended from crop insurance to ARC (Agriculture Risk Coverage) program yields, should also be part of the methodology for PLC payment yields? For example, should historic trend-adjusted yield be used for each year in PLC’s update window?
- Assuming PLC continues to rely on farm level yields, this analysis also prompts the specific policy question of whether producers should be required to annually report yields by FSA farm?
Data Notes
- Data are not available to calculate crambe and sesame US yield per acre. For the 21 other program commodities, planted yield equals (production/planted acres) except for corn, sorghum, and oats. For corn and sorghum, planted acres are reduced by harvested silage acres. For oats, harvest yield is used. Share of oats acres harvested has dropped from 48% in 1993 to 31% in 2017. Upland cotton yields are used for seed cotton since, as specified in the farm bill, yield for seed cotton is 2.4 times the yield of upland cotton. The constant 2.4 conversion factor means it cancels out in this analysis. Data are not available for Japonica rice, but most Japonica rice is California medium and short grain rice. This yield is used for Japonica rice. California medium and short grain rice are removed before calculating US medium and short grain rice yield.
- Trend yield is also estimated using data back to 1974, or for as long as available. Trend estimates differ, especially for a few crops; but do not impact the story that emerges from Figure 3.
- Trend yield for dry peas, lentils, mustard, and safflower is negative with 95% statistical confidence. The negative trends are used since the analysis concerns deviations from historic trends.
- Only sorghum did not have a statistically significant trend yield in the 1993-2017 analysis, even at 90% confidence. Sorghum’s trend for 1974-2017 is significant with 99% confidence. The coefficients are +0.32 and +0.21 for the longer and shorter period, respectively. Given the similar coefficients and statistical significance for 1974-2017, the +0.21 trend is used for sorghum.
Source:farmdocdaily