By Jim Jansen and Jeffrey Stokes
Recent findings from the USDA-National Agricultural Statistics Service reported Nebraska’s farm real estate value, which incorporates the average value of all agricultural land and buildings in 2021, increased by 11% to an average of $3,100 per acre (Figure 1). This marks a $310 per-acre increase year-over-year from the prior period (USDA-NASS 2021a). Overall, Nebraska saw the second highest percentage increase in the nation for rising farm real estate values by state. The improvement in real estate values follow the rise in commodity prices for corn, soybeans and wheat.
Many land industry participants and investors engaged in purchasing agricultural land have capitalized on the ability to secure fixed-term debt at historically low interest rates. Coupling these rates with stronger commodity margins for many crops fueled the increase in farm real estate value. Cropland values in 2021 for Nebraska rose by 13.8%, to an average of $4,960 per acre (USDA-NASS 2021a). The increase in cropland values were reported as the second highest in the nation. Kansas led the nation with an increase of 13.9% to an average of $2,370 per acre (USDA-NASS 2021a).
Pasture values increased at the much lower rate of 3.8% year-over-year to an average of $1,080 per acre (USDA-NASS 2021a). Cattle producers faced higher feed expenses in 2021 coupled with extensive drought during the grazing season across much of the western United States. These factors impacted the margins experienced by many operators, which were reflected in more gradual increases in pasture values across most of the U.S..
The USDA-National Agricultural Statistics service also reported on county-level cash rent estimates for the 2021 growing season (USDA-NASS 2021b). These estimates include cash rent averages for non-irrigated and irrigated cropland, in addition to pasture, on a per-acre basis. Differences in non-irrigated cropland rental rates in Nebraska are attributable to differences in soil type, rainfall, yield expectations and general competitiveness of different counties (Figure 2). Counties noted without an average appear in white and did not have enough responses returned by survey members to estimate a rate. These areas might also be in a portion of Nebraska where there may not be very many acres of non-irrigated cropland.
Irrigated cash rental rates for 2021 also reflect similar trends to the non-irrigated cropland (Figure 3). Higher rental rates tend to be reported in the eastern half of the state relative to the western half. Portions of southeast, north central and western Nebraska with lower numbers of irrigated acres also did not report rates. The irrigated cash rental rates represent a weighted average between the proportion of center pivot and gravity or flood irrigated acres. Reported irrigated rental rates also assume that the landlord owns the entire irrigation system on the leased property. Rates may be adjusted to reflect cases where the tenant provides a portion of the irrigation system.
Pasture or range land cash rental rates across Nebraska reflect the difference in productivity, stocking rates and market competitiveness (Figure 3). Reported pasture rates indicated the typical summer grazing rates. Off-season grazing rates during the fall, winter or during spring calving may be adjusted to reflect differences in forage quality or other market factors.
Additional details on the USDA-National Agricultural Statistics Service land values and cash rental publications may be found via the reference section of this article.
Figure 1. 2021 Farm Real Estate Values by State
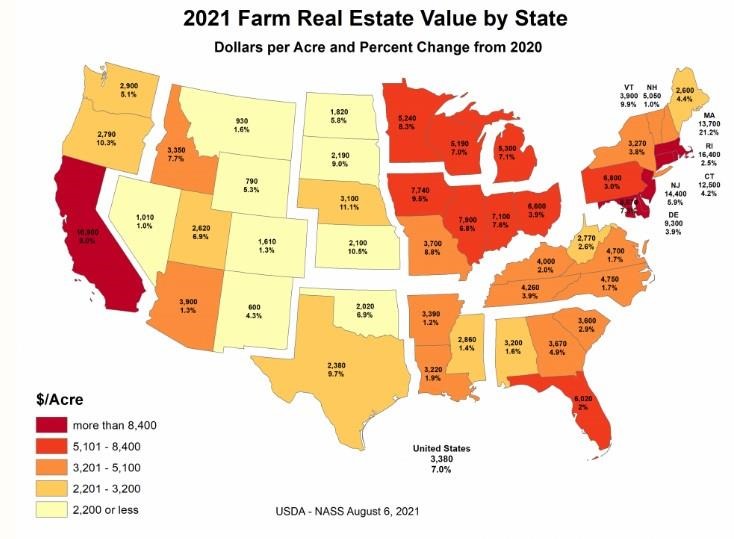
Source: Land Values 2021 Summary; USDA-National Agricultural Statistics Service, August 2021.
Figure 2. 2021 Nebraska Non-Irrigated Cropland Cash Rent Paid Per Acre
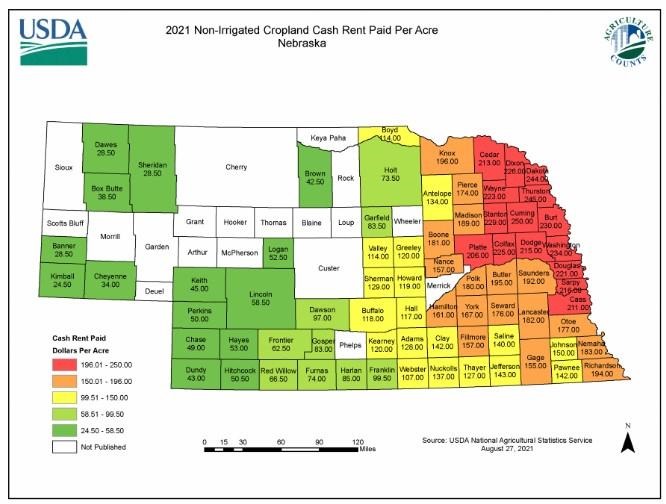
Source: 2021 Nebraska Cash Rents by County; USDA-National Agricultural Statistics Service, August 27, 2021.
Figure 3. 2021 Nebraska Irrigated Cropland Cash Rent Paid Per Acre
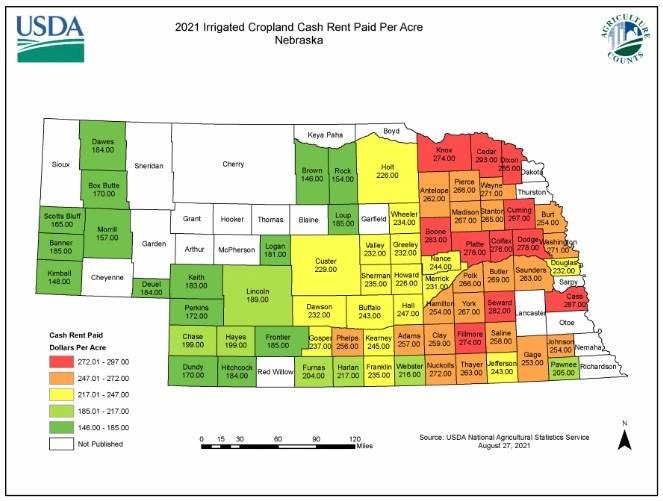
Source: 2021 Nebraska Cash Rents by County; USDA-National Agricultural Statistics Service, August 27, 2021.
Figure 4. 2021 Nebraska Pasture Cash Rent Paid Per Acre
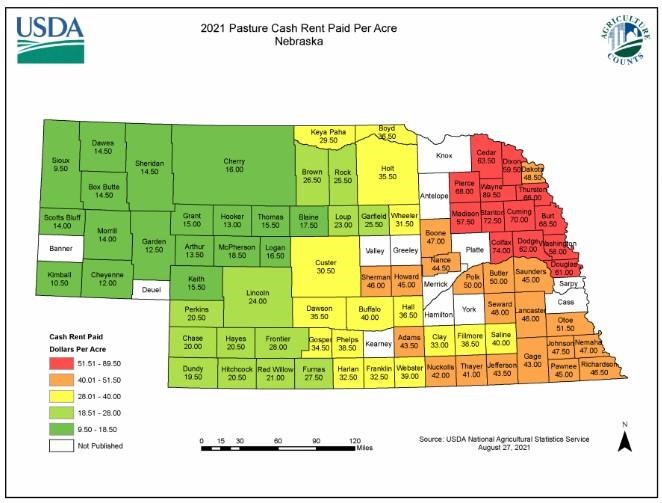
Source: 2021 Nebraska Cash Rents by County; USDA-National Agricultural Statistics Service, August 27, 2021.
Source : unl.edu