By Joe Janzen
Department of Agricultural and Consumer Economics
University of Illinois
The US Department of Agriculture released its latest World Agricultural Supply and Demand Estimates, or WASDE on Thursday, January 12. The January WASDE report is released concurrent with information on quarterly grain stocks and annual winter wheat seedings reports. With so much information, the January report typically garners greater interest and spurs larger price reactions than the typical USDA report release and this year was no exception.
Contrary to analyst expectations that 2022 US corn and soybean supply was basically settled, USDA made significant revisions to acreage and yield numbers that reduced the estimated size of the 2022 crop. This sent prices for both commodities higher despite a comparatively bearish outlook in the report for old-crop (2022/23) corn and soybean demand with lowered expectations for both corn and soybean exports.
At the start of a new calendar year, the corn and soybean market will closely consider the relationship between old-crop and new-crop (2023/24) supply and demand conditions. South American crop production and weather news will be a major market driver in the near-term with a large corn and soybean crop in Brazil expected to fill gaps in global commodity availability left by a below average US crop. The January report did revise Brazil corn and soybean production down slightly, but a record crop remains the expectation as the harvest period begins in South America.
Moving forward, prospects for 2023 US acreage and production will come under increasing scrutiny. Prices and futures calendar spreads will work to balance old-crop supply and demand with the expectations for the new-crop to be harvested in fall 2023. Reaction to the January report points to the prospect of lower corn and soybean prices in the medium- to long-term. Nearby futures increased more than new-crop prices in response to the report, widening the existing old-crop/new-crop inverse.
Latest US Corn and Soybean Supply and Demand Estimates
Table 1 shows the US corn and soybean balance sheets, a broad accounting of domestic supply and demand measures. The January WASDE report made significant changes to harvested acres and yield for both crops. Corn area harvested was pegged at 79.2 million acres, down 1.6 million acres and well outside the range of analysts’ forecasts reported by Bloomberg which ranged from 80.5 to 81.1 million acres. Similarly, soybean area harvested dropped 0.3 million acres to 86.3 million acres, a level at the low end of analysts’ forecasts.
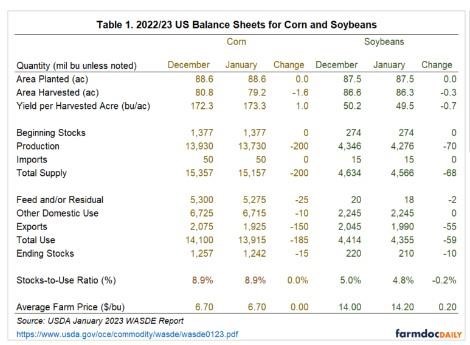
For corn, national average yield increased by one bushel per acre. This large increase was not enough to offset the decline in acreage, so total projected US corn production for 2022 fell by 200 million bushels. For soybeans, projected national average yield declined 0.7 bushels per acre to 49.5 leading to a 70 million bushel decrease in production. Compared to the overall size of each crop, these production revisions were roughly similar.
On the demand side, corn and soybean exports were revised lower. There has been continuing news about broad weakness in demand for US corn exports, in particular the competitiveness of Brazilian corn in the Chinese market. South American production similarly weighs on soybean exports, though export pace to date for soybeans has exceed corn. Corn exports were lowered 150 million bushels, continuing a change seen in the December report. Soybean exports declined 55 million bushels. Other corn use categories also were lowered signaling broader weakness in corn demand, though corn use for ethanol (not shown in Table 1) was left unchanged.
The net impact of these changes on old-crop ending stocks, the level of carryover to the new-crop marketing year necessary to balance available supply with current demand, was relatively small. The stocks-to-use ratio remained unchanged for corn and declined by 0.2 percentage points for soybeans. Many analysts expected a substantial increase in 2022/23 corn ending stocks with the average analysts guess reported by Bloomberg being 57 million bushels higher than the number in the December report. Instead ending stocks declined by 15 million bushels. Current stocks-to-use levels remain low in historic terms.
Impacts of the January WASDE Report
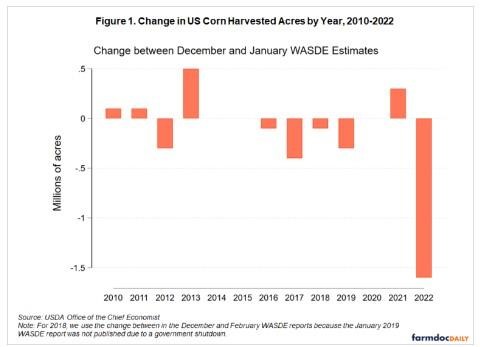
Corn and soybean prices gained on the release of the report. Combined with the negligible change in stocks-to-use ratios, this suggests production changes were the real surprise in the January WASDE. How large was this surprise? Figure 1 shows the change in US corn harvested acres between the December and January reports for each crop year since 2010. The 1.6 million acre decrease in the current report is more than three times the largest change previously observed over this period and one very much unanticipated by analysts.
Price reaction to the report was immediate and persisted through the remainder of the trading day. Table 2 shows futures market prices for selected old-crop and new-crop corn and soybean futures contracts. Nearby March futures rose 15 cents per bushel for corn and 26 cents per bushel for soybeans, compared to just 7 cents for new-crop December corn futures and 9 cents for new-crop November soybeans. This widened an already substantial inverse between old-crop and new-crop futures prices. Much higher prices for old-crop futures than for new-crop signals that commodity availability will ease in the medium- to long-term. This is a function of both production gains elsewhere in the world and an expected rebound in US production in 2023 from below-trend yields.
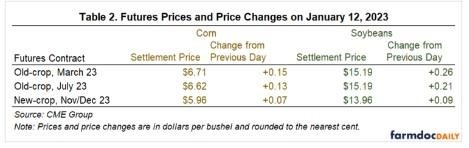
While the report was positive for corn and soybean prices, those gains were very much concentrated in the short-run on old-crop markets. Going forward, production decisions for the 2023 crop will come under scrutiny. Analysts will look for movement in relative prices between new-crop corn and soybean futures. Current new-crop prices levels do not strongly favor one crop over another; the new-crop soybean-corn price ratio given by price levels in Table 2 is approximately 2.34. Another thing to watch will be USDA’s initial corn and soybean balance sheets for the 2023/24 marketing year to be released at the USDA Agricultural Outlook Forum on February 23rd and 24th. Since the January WASDE report maintained tightness in US corn and soybean balance sheets, we can expect elevated price volatility in the months ahead.
Source : illinois.edu