Overview
Cotton was up; soybeans and wheat were down; and corn was mixed for the week.
The May WASDE, released on Tuesday, contained projections for the 2020 crop. Corn acres planted were 97 million (89.6 million harvested) and weather adjusted trend line yield was projected at 178.5 bu/acre. If realized U.S. production would be 15.995 billion bushels. A rebound in ethanol demand (5.2 billion), feed and residual use (6.05 billion) and exports (2.15 billion) to pre-COVID-19 levels would not offset increased production causing estimated ending stocks for the 2020/21 marketing year to balloon to 3.318 billion bushels, up 1.22 billion bushels compared to the projected ending stocks for the current marketing year (ending August 31, 2020). The season average price is projected at $3.20 down 40 cents year over year. It is important to point out that these are initial estimates and revisions are likely. Some estimates already have corn acres planted 2-3 million acres lower than the current USDA projections.
Soybean planted acres were projected at 83.5 million acres with a trend line yield of 49.8 bu/acre resulting in U.S. production of 4.125 billion bushels. Production, if realized, would be above last year’s prevented planting influenced estimate of 3.557, but below 2018’s estimate of 4.428 billion bushels. Continued strong domestic crush (2.13 billion bushels) and a rebound in exports (2.05 billion bushels) is projected to leave ending stocks at 405 million bushels down from the current marketing year projection of 580 million. Season average price is projected down 30 cents to $8.20/bu. Soybean acreage may increase due to reduced expected corn planting but ultimately soybean prices will be tightly tied to export sales and potential purchases from China.
Cotton planted acres were projected at 13.7 million (11.35 million harvested) and trend yield at 825 lb/acre, resulting in production of 19.5 million bales. Exports (16 million bales) and domestic use (2.9 million) are projected up year-over-year. However, domestic stocks are projected to increase 600,000 bales to 7.7 million. Season average price is projected at 57 cents, down 2 cents. Cotton prices will be driven by how quickly consumer purchasing and the global economy can recover from COVID-19 and if China imports additional U.S. cotton to replenish its reserves.
Wheat planted acres are projected at 44.7 million (37.3 million harvested) and trend yield at 49.5 bu/acre resulting in U.S. production of 1.866 billion bushels. Total use is projected at 2.075 billion, down 52 million compared to the current marketing year. 2020/21 ending stocks are projected at 909 million, down 69 million year-over-year. Season average price is projected at $4.60, unchanged from the current marketing year. Domestic production continues to decline, however global stocks are projected at a new all-time high.
Corn
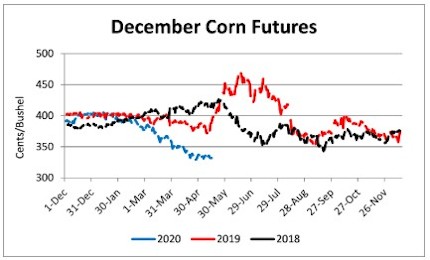
Ethanol production for the week ending May 8 was 0.617 million barrels per day, up 19,000 barrels from the previous week. Ethanol stocks were 24.190 million barrels, down 1.422 million barrels compare to last week. Corn net sales reported by exporters for May 1-7 were up compared to last week with net sales of 42.3 million bushels for the 2019/20 marketing year and 21.8 million bushels for the 2020/21 marketing year. Exports for the same time period were down 6% from last week at 51.6 million bushels. Corn export sales and commitments were 71% of the USDA estimated total exports for the 2019/20 marketing year (September 1 to August 31) compared to the previous 5-year average of 91%. Across Tennessee, average corn basis (cash price-nearby futures price) strengthened or remained unchanged at Memphis, Northwest, and Upper-middle Tennessee and weakened at Northwest Barge Points. Overall, basis for the week ranged from 12 under to 20 over, with an average of 6 over the July futures at elevators and barge points. July 2020 corn futures closed at $3.19, unchanged since last Friday. For the week, July 2020 corn futures traded between $3.14 and $3.24. Jul/Sep and Jul/Dec future spreads were 4 and 13 cents.
Corn | Jul 20 | Change | Dec 20 | Change |
Price | $3.19 | $0.00 | $3.32 | -$0.03 |
Support | $3.15 | $0.01 | $3.29 | -$0.02 |
Resistance | $3.22 | -$0.03 | $3.34 | -$0.06 |
20 Day MA | $3.18 | -$0.03 | $3.34 | -$0.03 |
50 Day MA | $3.36 | -$0.06 | $3.49 | -$0.05 |
100 Day MA | $3.64 | -$0.04 | $3.71 | -$0.04 |
4-Week High | $3.32 | -$0.06 | $3.45 | -$0.07 |
4-Week Low | $3.09 | $0.00 | $3.25 | $0.00 |
Technical Trend | Down | = | Down | = |
Nationally the Crop Progress report estimated corn planting at 67% compared to 51% last week, 28% last year, and a 5-year average of 56%; and corn emerged at 24% compared to 8% last week, 9% last year, and a 5-year average of 22%. In Tennessee, the Crop Progress report estimated corn planted at 67% compared to 54% last week, 75% last year, and a 5-year average of 82%; and corn emerged at 44% compared to 26% last week, 51% last year, and a 5-year average of 55%. In Tennessee, new crop cash corn contracts ranged from $3.03 to $3.29. September 2020 corn futures closed at $3.23, down 1 cent since last Friday. December 2020 corn futures closed at $3.32, down 3 cents since last Friday. Downside price protection could be obtained by purchasing a $3.40 December 2020 Put Option costing 26 cents establishing a $3.14 futures floor.
Soybeans
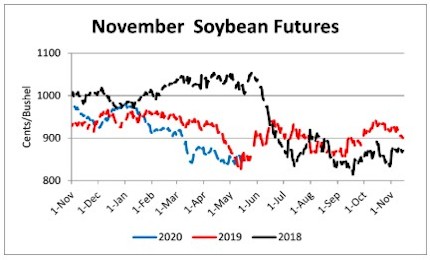
Net sales reported by exporters were up compared to last week with net sales of 24.1 million bushels for the 2019/20 marketing year and 16.2 million bushels for the 2020/21 marketing year. Exports for the same period were up 8% compared to last week at 17.4 million bushels. Soybean export sales and commitments were 72% of the USDA estimated total annual exports for the 2019/20 marketing year (September 1 to August 31), compared to the previous 5-year average of 97%. Average soybean basis strengthened at Memphis, Northwest Barge Points, Northwest, and Upper-middle Tennessee. Basis ranged from 20 under to 28 over the July futures contract at elevators and barge points. Average basis at the end of the week was 13 over the July futures contract. July 2020 soybean futures closed at $8.38, down 12 cents since last Friday. For the week, July 2020 soybean futures traded between $8.35 and $8.61. Jul/Aug and Jul/Nov future spreads were 2 and 7 cents. August 2020 soybean futures closed at $8.40, down 12 cents since last Friday. July soybean-to-corn price ratio was 2.63 at the end of the week.
Soybeans | Jul 20 | Change | Nov 20 | Change |
Price | $8.38 | -$0.12 | $8.45 | -$0.10 |
Support | $8.32 | $0.07 | $8.40 | -$0.01 |
Resistance | $8.45 | -$0.13 | $8.53 | -$0.13 |
20 Day MA | $8.42 | -$0.01 | $8.47 | -$0.03 |
50 Day MA | $8.56 | -$0.06 | $8.59 | -$0.07 |
100 Day MA | $8.94 | -$0.06 | $8.99 | -$0.06 |
4-Week High | $8.61 | -$0.16 | $8.65 | -$0.17 |
4-Week Low | $8.18 | $0.00 | $8.31 | $0.00 |
Technical Trend | Down | = | Down | = |
Nationally the Crop Progress report estimated soybean planting at 38% compared to 23% last week, 8% last year, and a 5-year average of 23% and soybeans emerged at 7% compared to 1% last year and a 5-year average of 4%. In Tennessee, soybeans planted were estimated at 20% compared to 14% last week, 17% last year, and a 5-year average of 19% and soybeans emerged at 6% compared to 3% last year and a 5-year average of 2%. In Tennessee, new crop soybean cash contracts ranged from $8.14 to $8.77. Nov/Dec 2020 soybean-to-corn price ratio was 2.55 at the end of the week. November 2020 soybean futures closed at $8.45, down 10 cents since last Friday. Downside price protection could be achieved by purchasing an $8.60 November 2020 Put Option which would cost 46 cents and set an $8.14 futures floor.
Cotton
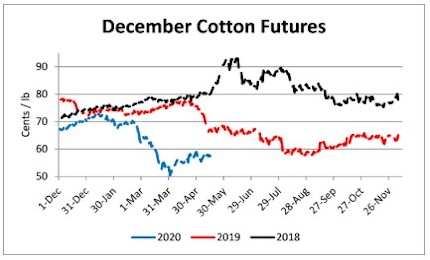
Net sales reported by exporters were down compared to last week with net sales of 238,100 bales for the 2019/20 marketing year and 93,300 bales for the 2020/21 marketing year. Exports for the same time period were down 35% compared to last week at 241,700 bales. Upland cotton export sales were 109% of the USDA estimated total annual exports for the 2019/20 marketing year (August 1 to July 31), compared to the previous 5-year average of 102%. Delta upland cotton spot price quotes for May 14 were 55.10 cents/lb (41-4-34) and 57.35 cents/lb (31-3-35). Adjusted World Price (AWP) increased 1.35 cents to 47.36 cents. July 2020 cotton futures closed at 58.25 cents, up 1.98 cents since last Friday. For the week, July 2020 cotton futures traded between 55.75 and 58.86 cents. Jul/Dec and Jul/Mar cotton futures spreads were 0.62 cents and -0.08 cents.
Cotton | Jul 20 | Change | Dec 20 | Change |
Price | 58.25 | 1.98 | 58.17 | 0.55 |
Support | 56.64 | 2.06 | 56.75 | 0.36 |
Resistance | 59.66 | 1.76 | 59.31 | 0.50 |
20 Day MA | 55.96 | 1.18 | 57.31 | 0.65 |
50 Day MA | 55.31 | -0.58 | 56.67 | -0.60 |
100 Day MA | 62.54 | -0.57 | 63.04 | -0.57 |
4-Week High | 58.86 | 0.88 | 59.50 | 0.00 |
4-Week Low | 52.01 | 0.00 | 54.30 | 0.00 |
Technical Trend | Up | + | Up | + |
Nationally, the Crop Progress report estimated cotton planted at 32%, compared to 18% last week, 24% last year, and a 5-year average of 27%. In Tennessee, cotton planted was estimated at 10% compared to 4% last week, 28% last year, and a 5-year average of 27%. December 2020 cotton futures closed at 58.17, up 0.55 cents since last Friday. Downside price protection could be obtained by purchasing a 59 cent December 2020 Put Option costing 4.83 cents establishing a 54.17 cent futures floor. March 2021 cotton futures closed at 58.87 cents, up 0.43 cents since last Friday.
Wheat
Wheat net sales reported by exporters were down compared to last week with net sales of 7.5 million bushels for the 2019/20 marketing year and 5.5 million bushels for the 2020/21 marketing year. Exports for the same time period were down 35% from last week at 13.5 million bushels. Wheat export sales were 102% of the USDA estimated total annual exports for the 2019/20 marketing year (June 1 to May 31), compared to the previous 5-year average of 105%.
Wheat | Jul 20 | Change | Sep 20 | Change |
Price | $5.00 | -$0.22 | $5.03 | -$0.22 |
Support | $4.91 | -$0.22 | $4.94 | -$0.22 |
Resistance | $5.12 | -$0.17 | $5.14 | -$0.17 |
20 Day MA | $5.23 | -$0.08 | $5.26 | -$0.09 |
50 Day MA | $5.31 | -$0.02 | $5.35 | -$0.02 |
100 Day MA | $5.43 | -$0.02 | $5.47 | -$0.03 |
4-Week High | $5.61 | -$0.03 | $5.64 | -$0.04 |
4-Week Low | $4.96 | -$0.09 | $5.00 | -$0.10 |
Technical Trend | Strong Down | - | Strong Down | - |
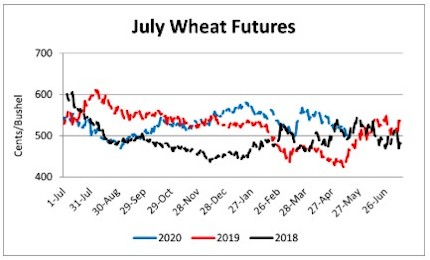
Nationally the Crop Progress report estimated winter wheat condition at 53% good-to-excellent and 16% poor-to-very poor; winter wheat headed at 44% compared to 32% last week, 38% last year, and a 5-year average of 50%; spring wheat planted at 42% compared to 29% last week, 38% last year, and a 5-year average of 63%; and spring wheat emerged at 16% compared to 6% last week, 8% last year, and a 5-year average of 29%. In Tennessee, winter wheat condition was estimated at 62% good-to-excellent and 4% poor-to-very poor; and winter wheat headed at 92% compared to 81% last week, 89% last year, and a 5-year average of 87%. In Tennessee, June/July 2020 cash contracts ranged from $4.83 to $5.37. July 2020 wheat futures closed at $5.00, down 22 cents since last Friday. July 2020 wheat futures traded between $4.96 and $5.28 this week. July wheat-to-corn price ratio was 1.57. Jul/Sept and Jul/Jul future spreads were 3 and 22 cents. September 2020 wheat futures closed at $5.03, down 22 cents since last Friday. September wheat-to-corn price ratio was 1.56. July 2021 wheat futures closed at $5.22, down 15 cents since last Friday. Downside price protection could be obtained by purchasing a $5.10 July 2021 Put Option costing 32 cents establishing a $4.78 futures floor.
Source : tennessee.edu