Overview
Corn, cotton, soybeans, and wheat were down for the week.
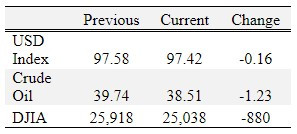
Commodity prices took a step backward this week as increased COVID-19 cases in several states has led to concerns over a slowing economic recovery or pausing/reversing of phased reopening. The demand disruptions caused by COVID-19 and trade uncertainty with China coupled with large global stocks and good growing conditions in the US continues to provide downward pressure for grain and oilseeds prices. Right now bearish market forces overwhelming outweigh bullish considerations. The unpredictability of the COVID-19 pandemic and the geopolitical relationship with China make price forecasting incredibly difficult. However, right now the trend for prices is sideways to lower. Expecting 2020 crop prices to get back to January 2020 levels seems unrealistic at this juncture.
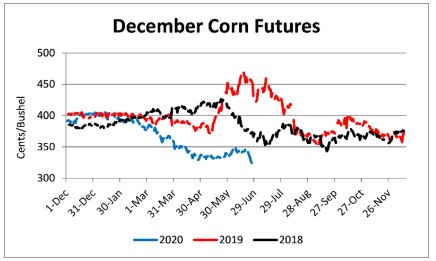
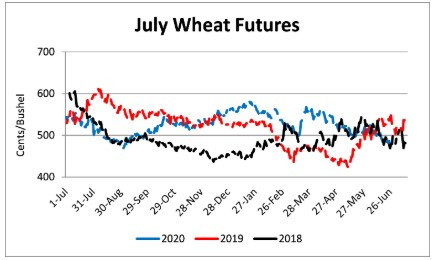
December corn set a new contract low on Friday at $3.22/bu and July wheat traded within ¼ of cent of the September 3, 2019 contract low of $4.68/bu.
CFAP payments have continued to be made to producers, providing some much needed financial relief. As at June 22, USDA FSA indicated payments of $15.66 million based 1,617 non-specialty crop producer applications in Tennessee. Nationally, non-specialty crop producers have received $1.04 billion for 146,424 applications. Producers have until August 28 to sign up for CFAP payments. Call your local FSA service center to make arrangements to complete the applications or visit https://www.farmers.gov/cfap.
On a slightly positive note, ethanol production rose for the 8th consecutive week, from a low of 537,000 barrels per day for the week ending April 24 to 893,000 barrels per day for the week ending June 19. Ethanol production is still 16.6% lower than this week last year. Ethanol stocks have reduced for the 9th consecutive week decreasing from 27.689 million barrels on April 19 to 21.034 million barrels on June 19. Ethanol stocks are 2.5% lower than this week last year. Lower stocks and increased production will help with corn demand, but the recent increases in COVID-19 cases in Texas and Florida could slow the economic recovery and reduce fuel demand.
Corn
Ethanol production for the week ending June 19 was 0.893 million barrels per day, up 52,000 barrels from the previous week. Ethanol stocks were 21.034 million barrels, down 0.312 million barrels compared to last week. Corn net sales reported by exporters for June 12-18 were up compared to last week with net sales of 18.2 million bushels for the 2019/20 marketing year and 3.0 million bushels for the 2020/21 marketing year. Exports for the same time period were up 50% from last week at 51.7 million bushels. Corn export sales and commitments were 93% of the USDA estimated total exports for the 2019/20 marketing year (September 1 to August 31) compared to the previous 5-year average of 99%. Across Tennessee, average corn basis (cash price-nearby futures price) strengthened or remained unchanged at Memphis, Northwest Barge Points, Northwest, and Upper-middle Tennessee. Overall, basis for the week ranged from 5 under to 26 over, with an average of 17 over the July futures at elevators and barge points. July 2020 corn futures closed at $3.17, down 15 cents since last Friday. For the week, July 2020 corn futures traded between $3.13 and $3.32. Jul/Sep and Jul/Dec future spreads were 2 and 8 cents.
Corn | Jul 20 | Change | Dec 20 | Change |
Price | $3.17 | -$0.15 | $3.25 | -$0.20 |
Support | $3.10 | -$0.15 | $3.17 | -$0.19 |
Resistance | $3.23 | -$0.14 | $3.34 | -$0.16 |
20 Day MA | $3.27 | $0.00 | $3.40 | $0.00 |
50 Day MA | $3.22 | -$0.01 | $3.36 | -$0.02 |
100 Day MA | $3.43 | -$0.03 | $3.54 | -$0.03 |
4-Week High | $3.34 | $0.00 | $3.48 | $0.00 |
4-Week Low | $3.13 | -$0.03 | $3.22 | -$0.08 |
Technical Trend | Strong Down | - | Strong Down | - |
Nationally the Crop Progress report estimated corn condition at 72% good-to-excellent and 5% poor-to-very poor; and corn silking at 2% compared to 1% last year and a 5-year average of 2%. In Tennessee, the Crop Progress report estimated corn condition at 73% good-to-excellent and 5% poor-to-very poor; and corn silking at 5% compared to 2% last week, 23% last year, and a 5-year average of 16%. In Tennessee, new crop cash corn contracts ranged from $3.04 to $3.48. September 2020 corn futures closed at $3.19, down 18 cents since last Friday. December 2020 corn futures closed at $3.25, down 20 cents since last Friday. Downside price protection could be obtained by purchasing a $3.30 December 2020 Put Option costing 20 cents establishing a $3.10 futures floor.
Soybeans
Net sales reported by exporters were down compared to last week with net sales of 22.1 million bushels for the 2019/20 marketing year and 20.6 million bushels for the 2020/21 marketing year. Exports for the same period were down 22% compared to last week at 11.1 million bushels. Soybean export sales and commitments were 100% of the USDA estimated total annual exports for the 2019/20 marketing year (September 1 to August 31), compared to the previous 5-year average of 101%. Average soybean basis strengthened or remained unchanged at Memphis, Northwest Barge Points, Upper-middle, and Northwest Tennessee. Basis ranged from 16 under to 34 over the July futures contract at elevators and barge points. Average basis at the end of the week was 14 over the July futures contract. July 2020 soybean futures closed at $8.65, down 11 cents since last Friday. For the week, July 2020 soybean futures traded between $8.61 and $8.79. Jul/Aug and Jul/Nov future spreads were -5 and -4 cents. August 2020 soybean futures closed at $8.60, down 16 cents since last Friday. July soybean-to-corn price ratio was 2.73 at the end of the week.
Soybeans | Jul 20 | Change | Nov 20 | Change |
Price | $8.65 | -$0.11 | $8.61 | -$0.19 |
Support | $8.57 | -$0.10 | $8.52 | -$0.17 |
Resistance | $8.75 | -$0.10 | $8.74 | -$0.15 |
20 Day MA | $8.66 | $0.07 | $8.72 | $0.04 |
50 Day MA | $8.52 | $0.02 | $8.58 | $0.00 |
100 Day MA | $8.68 | -$0.02 | $8.73 | -$0.03 |
4-Week High | $8.80 | $0.00 | $8.84 | $0.00 |
4-Week Low | $8.34 | $0.06 | $8.45 | $0.05 |
Technical Trend | Down | - | Down | - |
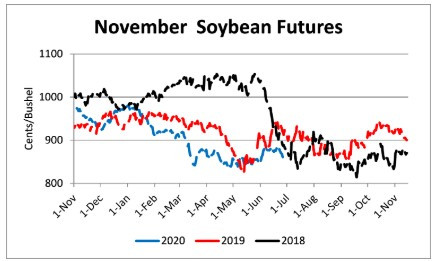
Nationally the Crop Progress report estimated soybean condition at 70% good-to-excellent and 5% poor-to-very poor; soybeans planted at 96% compared to 93% last week, 83% last year, and a 5-year average of 93%; soybeans emerged at 89% compared to 81% last week, 66% last year, and a 5-year average of 85%; and soybeans blooming at 5% compared to 1% last year and a 5-year average of 5%. In Tennessee, soybean condition was estimated at 74% good-to-excellent and 4% poor-to-very poor; soybeans planted at 86% compared to 75% last week, 89% last year, and a 5-year average of 87%; soybeans emerged at 70% compared to 58% last week, 77% last year, and a 5-year average of 73%; and soybeans blooming at 2% compared to 4% last year and a 5-year average of 4%. In Tennessee, new crop soybean cash contracts ranged from $8.46 to $9.04. Nov/Dec 2020 soybean-to-corn price ratio was 2.65 at the end of the week. November 2020 soybean futures closed at $8.61, down 19 cents since last Friday. Downside price protection could be achieved by purchasing an $8.80 November 2020 Put Option which would cost 40 cents and set an $8.40 futures floor.
Cotton
Net sales reported by exporters were down compared to last week with net sales of 102,700 bales for the 2019/20 marketing year and 67,900 bales for the 2020/21 marketing year. Exports for the same time period were down 9% compared to last week at 316,100 bales. Upland cotton export sales were 121% of the USDA estimated total annual exports for the 2019/20 marketing year (August 1 to July 31), compared to the previous 5-year average of 106%. Delta upland cotton spot price quotes for June 25 were 58.14 cents/lb (41-4-34) and 60.39 cents/lb (31-3-35). Adjusted World Price (AWP) increased 0.73 cents to 49.6 cents. July 2020 cotton futures closed at 60.55 cents, down 1.01 cents since last Friday. For the week, July 2020 cotton futures traded between 60.01 and 63.14 cents. Jul/Dec and Jul/Mar cotton futures spreads were -0.39 cent and -1.05 cents.
Cotton | Jul 20 | Change | Dec 20 | Change |
Price | 60.55 | -1.01 | 59.50 | -0.31 |
Support | 59.32 | -1.24 | 58.95 | -0.01 |
Resistance | 62.12 | -0.38 | 60.13 | -0.49 |
20 Day MA | 60.86 | 1.02 | 59.61 | 0.44 |
50 Day MA | 58.24 | 0.87 | 58.34 | 0.42 |
100 Day MA | 59.23 | -0.38 | 59.65 | -0.48 |
4-Week High | 63.14 | 0.82 | 61.14 | 0.00 |
4-Week Low | 56.56 | 0.00 | 56.43 | 0.00 |
Technical Trend | Up | = | Down | - |
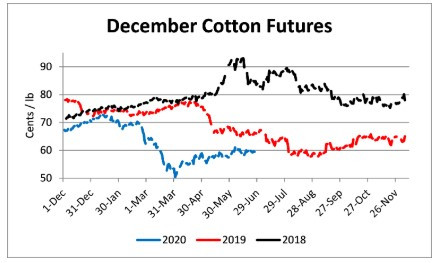
Nationally, the Crop Progress report estimated cotton condition at 40% good-to-excellent and 25% poor-to-very poor; cotton planted at 96% compared to 89% last week, 94% last year, and a 5-year average of 96%; cotton squaring at 27% compared to 16% last week, 27% last year, and a 5-year average of 26%; and cotton setting bolls at 6% compared to 2% last year and a 5-year average of 4%. In Tennessee, cotton condition was estimated at 60% good-to-excellent and 14% poor-to-very poor; cotton planted at 96% compared to 93% last week, 100% last year, and a 5-year average of 100%; and cotton squaring at 17% compared to 12% last week, 33% last year, and a 5-year average of 31%. December 2020 cotton futures closed at 59.5, down 0.31 cents since last Friday. Downside price protection could be obtained by purchasing a 60 cent December 2020 Put Option costing 3.5 cents establishing a 56.5 cent futures floor. March 2021 cotton futures closed at 60.16 cents, down 0.4 cents since last Friday.
Wheat
Wheat net sales reported by exporters were up compared to last week with net sales of 19.1 million bushels for the 2020/21 marketing year. Exports for the same time period were up 46% from last week at 26.1 million bushels. Wheat export sales were 27% of the USDA estimated total annual exports for the 2020/21 marketing year (June 1 to May 31), compared to the previous 5-year average of 28%.
Wheat | Jul 20 | Change | Sep 20 | Change |
Price | $4.74 | -$0.07 | $4.75 | -$0.10 |
Support | $4.57 | -$0.14 | $4.60 | -$0.16 |
Resistance | $4.84 | -$0.06 | $4.96 | $0.01 |
20 Day MA | $4.98 | -$0.07 | $5.02 | -$0.07 |
50 Day MA | $5.10 | -$0.07 | $5.14 | -$0.07 |
100 Day MA | $5.25 | -$0.03 | $5.29 | -$0.04 |
4-Week High | $5.29 | $0.00 | $5.32 | $0.00 |
4-Week Low | $4.68 | -$0.08 | $4.71 | -$0.10 |
Technical Trend | Strong Down | = | Strong Down | = |
Nationally the Crop Progress report estimated winter wheat condition at 52% good-to-excellent and 17% poor-to-very poor; winter wheat headed at 96% compared to 91% last week, 93% last year, and a 5-year average of 97%; winter wheat harvested at 29% compared to 15% last week, 13% last year, and a 5-year average of 26%; spring wheat condition at 75% good-to-excellent and 4% poor-to-very poor; and spring wheat headed at 12% compared to 4% last week, 6% last year, and a 5-year average of 22%. In Tennessee, winter wheat condition was estimated at 53% good-to-excellent and 13% poor-to-very poor; winter wheat mature at 95% compared to 69% last week, 95% last year, and a 5-year average of 92%; and winter wheat harvest at 62% compared to 19% last week, 69% last year, and a 5-year average of 68%. In Tennessee, June/July 2020 cash contracts ranged from $4.66 to $5.03. July 2020 wheat futures closed at $4.74, down 7 cents since last Friday. July 2020 wheat futures traded between $4.68 and $4.89 this week. July wheat-to-corn price ratio was 1.50. Jul/Sept and Jul/Jul future spreads were 1 and 26 cents. September 2020 wheat futures closed at $4.75, down 10 cents since last Friday. September wheat-to-corn price ratio was 1.49. July 2021 wheat futures closed at $5.00, down 12 cents since last Friday. Downside price protection could be obtained by purchasing a $5.00 July 2021 Put Option costing 33 cents establishing a $4.77 futures floor.
Source : tennessee.edu