Overview
Corn, cotton, soybeans, and wheat were down for the week.
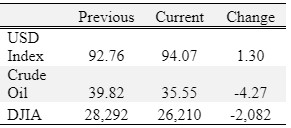
Corn decreased over 20 cents, soybeans over 40 cents, and cotton over 3 cents from early week highs. End of month position shifts from managed money, a dramatic spike in COVID-19 cases in the U.S., stock market declines, and economic uncertainty/rising lockdowns across the globe prompted commodity price declines across the board.
On August 10, November soybean futures closed at $8.73 ¼, since then prices have increased to a high of $10.94, an increase of $2.20 ¾. Similarly, December corn futures increased from $3.23 on August 10 to a high of $4.22 ¼, an increase of $0.99 ¼; and December cotton futures prices increased from 62.80 on August 10 to a high of 72.60, an increase of 9.8 cents. Dramatic price increases during harvest are unusual, but not unprecedented. The main causes of the rally have been weather (domestically: hurricanes, wind storms, flash droughts; and globally) and strong export sales (led by purchases from China).
So with a short-term down trend and a longer-term uptrend, what should producers with unpriced production do? This will depend on what the producer has invested in the crop, yields, storage, and if current price offerings provide acceptable profit versus the risk of holding on for additional price increases. However in general, for corn, cash sales or securing a futures price should be considered with futures prices over $4. Even if production is to be stored producers may want to get a futures price or price floor on production and allow basis to seasonally strengthen. For soybeans, producers may want to get more aggressive with sales. $10.50 futures plus basis is still a very good price considering all that has occurred in 2020. While prices may go higher, there is a tremendous amount of uncertainty due to South American crop progress and export sales to China. Both are unpredictable and could create volatility (downside risk/upside potential) in the market as we move toward 2021.
Cotton prices may have peaked this week. Particularly considering the rapid rise in COVID-19 cases in many countries. Which could trigger additional lockdowns in several countries and increase global economic uncertainty.
Next week is the U.S. election which could also add to volatility across agricultural and non-agricultural markets.
Corn
Ethanol production for the week ending October 23 was 0.941 million barrels per day, up 28,000 barrels from the previous week. Ethanol stocks were 19.601 million barrels, down 0.120 million barrels compared to last week. Corn net sales reported by exporters for October 16-22 were up compared to last week with net sales of 88.3 million bushels for the 2020/21 marketing year. Exports for the same time period were down 18% from last week at 28.9 million bushels. Corn export sales and commitments were 52% of the USDA estimated total exports for the 2020/21 marketing year (September 1 to August 31) compared to the previous 5-year average of 34%.
Corn | Dec 20 | Change | Mar 21 | Change |
Price | $3.98 | -$0.21 | $4.03 | -$0.17 |
Support | $3.87 | -$0.20 | $3.90 | -$0.19 |
Resistance | $4.04 | -$0.19 | $4.12 | -$0.12 |
20 Day MA | $4.00 | $0.08 | $4.05 | $0.06 |
50 Day MA | $3.78 | $0.06 | $3.86 | $0.05 |
100 Day MA | $3.58 | $0.04 | $3.67 | $0.02 |
4-Week High | $4.22 | $0.02 | $4.22 | $0.01 |
4-Week Low | $3.77 | $0.17 | $3.86 | $0.17 |
Technical Trend | Up | = | Up | = |
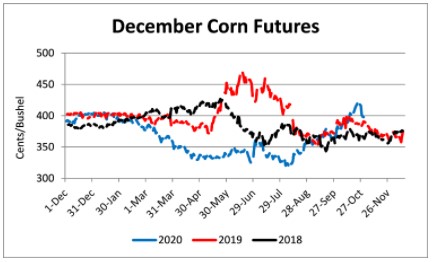
Nationally the Crop Progress report estimated corn harvested at 72% compared to 60% last week, 38% last year, and a 5-year average of 56%. In Tennessee, the Crop Progress report estimated corn condition at 75% good-to-excellent and 4% poor-to-very poor; and corn harvested at 91% compared to 83% last week, 97% last year, and a 5-year average of 96%. Across Tennessee, average corn basis (cash price-nearby futures price) strengthened or remained unchanged at Mississippi River, North-Central, West-Central, West, and Northwest elevators and barge point. Overall, basis for the week ranged from 20 under to 30 over, with an average of 12 over the December futures. December 2020 corn futures closed at $3.98, down 21 cents since last Friday. For the week, December 2020 corn futures traded between $3.93 and $4.22. Dec/Mar and Dec/Dec future spreads were 5 and -11 cents. Downside price protection could be obtained by purchasing a $4.00 December 2020 Put Option costing 12 cents establishing a $3.88 futures floor. In Tennessee, cash corn contracts ranged from $3.78 to $4.58. March 2021 corn futures closed at $4.03, down 17 cents since last Friday. December 2021 corn futures closed at $3.87, down 7 cents since last Friday.
Soybeans
Net sales reported by exporters were down compared to last week with net sales of 59.6 million bushels for the 2020/21 marketing year and 0.3 million bushels for the 2021/22 marketing year. Exports for the same period were up 7% compared to last week at 99.1 million bushels. Soybean export sales and commitments were 78% of the USDA estimated total annual exports for the 2020/21 marketing year (September 1 to August 31), compared to the previous 5-year average of 50%.
Soybeans | Nov 20 | Change | Jan 21 | Change |
Price | $10.56 | -$0.27 | $10.56 | -$0.25 |
Support | $10.43 | -$0.09 | $10.42 | -$0.10 |
Resistance | $10.66 | -$0.29 | $10.62 | -$0.31 |
20 Day MA | $10.58 | $0.14 | $10.57 | $0.12 |
50 Day MA | $10.12 | $0.16 | $10.15 | $0.15 |
100 Day MA | $9.50 | $0.10 | $9.53 | $0.09 |
4-Week High | $10.94 | $0.06 | $10.88 | $0.02 |
4-Week Low | $10.13 | $0.28 | $10.16 | $0.26 |
Technical Trend | Up | = | Up | = |
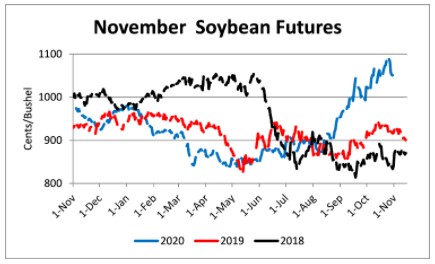
Nationally the Crop Progress report estimated soybeans harvested at 83% compared to 75% last week, 57% last year, and a 5-year average of 73%. In Tennessee, soybeans harvested at 51% compared to 41% last week, 69% last year, and a 5-year average of 66%. Across Tennessee, average soybean basis strengthened or remained unchanged at Mississippi River, West, West-Central, North-Central, and Northwest elevators and barge points. Basis ranged from 10 under to 30 over the November futures contract. Average basis at the end of the week was 20 over the November futures contract. November 2020 soybean futures closed at $10.56, down 27 cents since last Friday. For the week, November 2020 soybean futures traded between $10.47 and $10.94. Nov/Jan and Nov/Nov future spreads were 0 and -85 cents. November/December soybean-to-corn price ratio was 2.65 at the end of the week. In Tennessee, soybean cash contracts ranged from $10.52 to $11.28. January 2021 soybean futures closed at $10.56, down 25 cents since last Friday. November 2021 soybean futures closed at $9.71, down 11 cents since last Friday. Downside price protection could be achieved by purchasing a $9.80 November 2020 Put Option which would cost 64 cents and set a $9.16 futures floor. Nov/Dec 2021 soybean-to-corn price ratio was 2.51 at the end of the week.
Cotton
Net sales reported by exporters were up compared to last week with net sales of 288,700 bales for the 2020/21 marketing year and 900 bales for the 2021/22 marketing year. Exports for the same time period were up 18% compared to last week at 228,800 bales. Upland cotton export sales were 65% of the USDA estimated total annual exports for the 2020/21 marketing year (August 1 to July 31), compared to the previous 5-year average of 56%. Delta upland cotton spot price quotes for October 29 were 66.82 cents/lb (41-4-34) and 69.07 cents/lb (31-3-35). Adjusted World Price (AWP) increased 1.66 cents to 57.37 cents.
Cotton | Dec 20 | Change | Mar 21 | Change |
Price | 68.92 | -2.37 | 69.78 | -2.09 |
Support | 67.43 | -2.91 | 68.42 | -2.66 |
Resistance | 70.79 | -2.11 | 71.64 | -1.72 |
20 Day MA | 69.52 | 1.23 | 70.27 | 1.24 |
50 Day MA | 67.03 | 0.71 | 67.86 | 0.70 |
100 Day MA | 64.50 | 0.51 | 65.27 | 0.53 |
4-Week High | 72.60 | 0.47 | 73.27 | 0.47 |
4-Week Low | 64.86 | 0.21 | 65.71 | 0.23 |
Technical Trend | Up | = | Up | = |
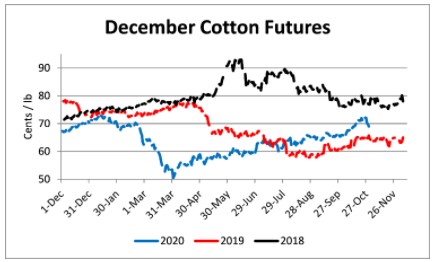
Nationally, the Crop Progress report estimated cotton condition at 40% good-to-excellent and 31% poor-to-very poor; cotton bolls opening at 95% compared to 93% last week, 94% last year, and a 5-year average of 92%; and cotton harvested at 42% compared to 34% last week, 44% last year, and a 5-year average of 42%. In Tennessee, cotton condition was estimated at 64% good-to-excellent and 18% poor-to-very poor; cotton bolls opening at 98% compared to 95% last week, 99% last year, and a 5-year average of 99%; and cotton harvested at 46% compared to 32% last week, 58% last year, and a 5-year average 59%. December 2020 cotton futures closed at 68.92, down 2.37 cents since last Friday. For the week, December 2020 cotton futures traded between 68.37 and 72.6 cents. Dec/Mar and Dec/Dec cotton futures spreads were 0.86 cents and -0.51 cents. Downside price protection could be obtained by purchasing a 69 cent December 2020 Put Option costing 1.25 cents establishing a 67.75 cent futures floor. March 2021 cotton futures closed at 69.78 cents, down 2.09 cents since last Friday. December 2021 cotton futures closed at 68.41 cents, down 1.78 cents since last Friday.
Wheat
Wheat net sales reported by exporters were up compared to last week with net sales of 27.3 million bushels for the 2020/21 marketing year and 2.2 million bushels for the 2021/22 marketing year. Exports for the same time period were up 130% from last week at 16.3 million bushels. Wheat export sales were 61% of the USDA estimated total annual exports for the 2020/21 marketing year (June 1 to May 31), compared to the previous 5-year average of 61%.
Wheat | Dec 20 | Change | Jul 21 | Change |
Price | $5.98 | -$0.34 | $5.92 | -$0.26 |
Support | $5.91 | -$0.23 | $5.83 | -$0.23 |
Resistance | $6.17 | -$0.19 | $6.04 | -$0.19 |
20 Day MA | $6.09 | $0.11 | $6.02 | $0.06 |
50 Day MA | $5.74 | $0.09 | $5.78 | $0.06 |
100 Day MA | $5.45 | $0.04 | $5.53 | $0.03 |
4-Week High | $6.38 | $0.00 | $6.24 | $0.00 |
4-Week Low | $5.61 | $0.24 | $5.69 | $0.19 |
Technical Trend | Up | = | Up | = |
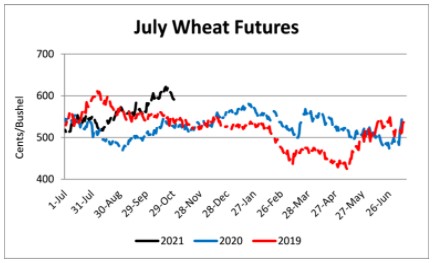
Nationally the Crop Progress report estimated winter wheat condition at 41% good-to-excellent and 19% poor-to-very poor; winter wheat planted at 85% compared to 77% last week, 83% last year, and a 5-year average of 80%; and winter wheat emerged at 62% compared to 51% last week, 60% last year, and 5-year average of 60%. In Tennessee, winter wheat condition was estimated at 65% good-to-excellent and 3% poor-to-very poor; winter wheat planted was estimated at 56% compared to 41% last week, 45% last year, and a 5-year average of 51%; and winter wheat emerged at 36% compared to 22% last week, 18% last year, and a 5-year average of 23%. December 2020 wheat futures closed at $5.98, down 34 cents since last Friday. December 2020 wheat futures traded between $5.95 and $6.33 this week. December wheat-to-corn price ratio was 1.50. Dec/Mar and Dec/Jul future spreads were 2 and -6 cents. March 2021 wheat futures closed at $6.00, down 26 cents since last Friday. In Tennessee, new crop wheat cash contracts ranged from $5.80 to $6.18. July 2021 wheat futures closed at $5.92, down 26 cents since last Friday. Downside price protection could be obtained by purchasing a $6.00 July 2021 Put Option costing 47 cents establishing a $5.53 futures floor.
Source : tennessee.edu