Overview
Corn, cotton, soybeans, and wheat were down for the week.
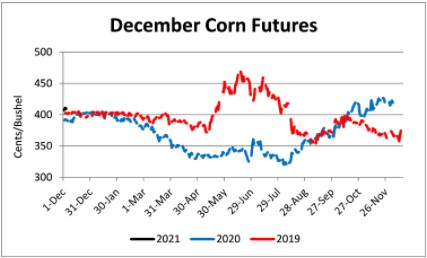
March corn set a new contract high on November 30 at $4.39 ½. With export sales remaining very strong and weather concerns in South America potentially affecting production corn could continue to rally into the New Year. One caution would be ethanol, both on the policy side -- RFS uncertainty-- and demand -- production was down this week and stocks were up to their highest level since early June.
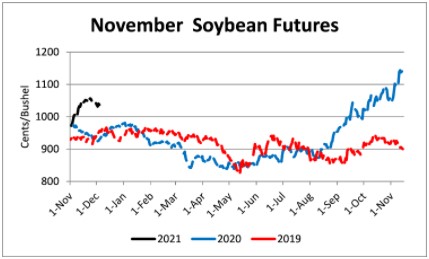
For the first time since August some weakness has crept into January soybean futures. While it is still too early to rule out another leg up in the current rally, projected improvements in Brazil’s weather and a subsidence in China’s import demand appear to have at least temporarily paused price increases. Ending U.S stocks below 200 million bushels and a smaller South American crop, than was anticipated, leaves the possibility of a move upward still on the table. Due to these mixed signals, we could see increased volatility enter the market for the remainder of 2020 and into 2021.
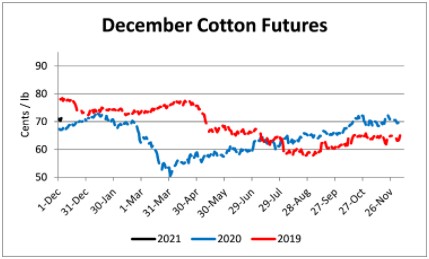
March cotton futures set a one year high on Thanksgiving week of 74.27. For cotton to run above 75 cents it will take cuts to estimated U.S. production and/or strong export sales. Large global and U.S. stocks combined with global economic uncertainty due to COVID-19 could pressure cotton prices lower as we move through the winter. December 2021 cotton futures have traded sideways between 68 and 72 cents since mid-October. Without a decline in soybean and corn prices or a substantial increase in cotton prices the U.S. could see a substantial reduction in cotton acreage in 2021, particularly in the Mississippi Delta and Atlantic regions of the cotton belt.
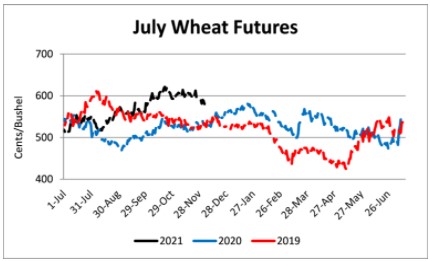
July wheat futures are now 43 ½ cents lower than the October 21 high of $6.24 ¾. Drought concerns have diminished over the past two months and global stocks remain record high. With much of the U.S. crop entering dormancy, markets will evaluate production information in other countries and global demand to look for market direction.
Corn
Ethanol production for the week ending November 27 was 0.974 million barrels per day, down 16,000 barrels from the previous week. Ethanol stocks were 21.240 million barrels, up 0.374 million barrels compared to last week. Corn net sales reported by exporters for November 20-26 were down compared to last week with net sales of 54.0 million bushels for the 2020/21 marketing year. Exports for the same time period were up 23% from last week at 42.2 million bushels. Corn export sales and commitments were 57% of the USDA estimated total exports for the 2020/21 marketing year (September 1 to August 31) compared to the previous 5-year average of 44%. Across Tennessee, average corn basis (cash price-nearby futures price) strengthened at North-Central, Mississippi River, West-Central, Northwest, and West elevators and barge points. Overall, basis for the week ranged from 21 under to 24 over, with an average of 13 over the March futures. March 2021 corn futures closed at $4.20, down 13 cents since last Friday. For the week, March 2021 corn futures traded between $4.14 and $4.39. Mar/May and Mar/Dec future spreads were 3 and -10 cents. May 2021 corn futures closed at $4.23, down 13 cents since last Friday.
Corn | Mar 21 | Change | Dec 21 | Change |
Price | $4.20 | -$0.13 | $4.10 | -$0.04 |
Support | $4.14 | -$0.07 | $4.05 | -$0.03 |
Resistance | $4.29 | -$0.12 | $4.14 | -$0.03 |
20 Day MA | $4.25 | $0.04 | $4.07 | $0.05 |
50 Day MA | $4.10 | $0.04 | $3.98 | $0.02 |
100 Day MA | $3.84 | $0.04 | $3.86 | $0.02 |
4-Week High | $4.39 | $0.04 | $4.15 | $0.01 |
4-Week Low | $4.08 | $0.12 | $3.92 | $0.11 |
Technical Trend | Up | = | Up | = |
December 2021 corn futures closed at $4.10, down 4 cents since last Friday. Downside price protection could be obtained by purchasing a $4.20 December 2021 Put Option costing 38 cents establishing a $3.82 futures floor.
Corn Futures Graph
Soybeans
In Tennessee, the Crop Progress report estimated soybeans harvested at 95% compared to 87% last week, 94% last year, and a 5-year average of 94%. Net sales reported by exporters were down compared to last week with net sales of 15.0 million bushels for the 2020/21 marketing year – a marketing year low. Exports for the same period were up 3% compared to last week at 91.6 million bushels. Soybean export sales and commitments were 87% of the USDA estimated total annual exports for the 2020/21 marketing year (September 1 to August 31), compared to the previous 5-year average of 62%. Across Tennessee, average soybean basis strengthened at Mississippi River, West, West-Central, North-Central, and Northwest elevators and barge points. Basis ranged from 25 under to 23 over the January futures contract. Average basis at the end of the week was 10 over the January futures contract. January 2021 soybean futures closed at $11.63, down 28 cents since last Friday. For the week, January 2021 soybean futures traded between $11.42 and $11.99. Jan/Mar and Jan/Nov future spreads were 2 and -125 cents. March 2021 soybean futures closed at $11.65, down 27 cents since last Friday. March 2021 soybean-to-corn price ratio was 2.77 at the end of the week.
Soybeans | Jan 21 | Change | Nov 21 | Change |
Price | $11.63 | -$0.28 | $10.38 | -$0.19 |
Support | $11.49 | -$0.24 | $10.30 | -$0.11 |
Resistance | $11.79 | -$0.24 | $10.46 | -$0.20 |
20 Day MA | $11.61 | $0.22 | $10.39 | $0.13 |
50 Day MA | $10.95 | $0.14 | $9.99 | $0.08 |
100 Day MA | $10.16 | $0.13 | $9.60 | $0.07 |
4-Week High | $12.00 | $0.00 | $10.60 | $0.00 |
4-Week Low | $10.83 | $0.38 | $9.87 | $0.26 |
Technical Trend | Up | = | Up | = |
November 2021 soybean futures closed at $10.38, down 19 cents since last Friday. Downside price protection could be achieved by purchasing a $10.40 November 2021 Put Option which would cost 65 cents and set a $9.75 futures floor. Nov/Dec 2021 soybean-to-corn price ratio was 2.53 at the end of the week.
Cotton
Nationally, the Crop Progress report estimated cotton harvested at 84% compared to 77% last week, 82% last year, and a 5-year average of 79%. In Tennessee, cotton harvested was estimated at 96% compared to 90% last week, 93% last year, and a 5-year average 95%. Net sales reported by exporters were down compared to last week with net sales of 277,900 bales for the 2020/21 marketing year and 21,800 for the 2021/22 marketing year. Exports for the same time period were down 1% compared to last week at 180,800 bales. Upland cotton export sales were 73% of the USDA estimated total annual exports for the 2020/21 marketing year (August 1 to July 31), compared to the previous 5-year average of 64%. Delta upland cotton spot price quotes for December 3 were 68.36 cents/lb (41-4-34) and 70.61 cents/lb (31-3-35). Adjusted World Price (AWP) decreased 0.21 cents to 58.42 cents. March 2021 cotton futures closed at 71.57, down 1.67 cents since last Friday. For the week, March 2021 cotton futures traded between 71.07 and 73.48 cents. Mar/May and Mar/Dec cotton futures spreads were 0.88 cents and -0.87 cents. May 2021 cotton futures closed at 72.45 cents, down 1.61 cents since last Friday.
Cotton | Mar 21 | Change | Dec 21 | Change |
Price | 71.57 | -1.67 | 70.70 | -0.74 |
Support | 70.48 | -1.47 | 69.88 | -0.48 |
Resistance | 72.30 | -1.85 | 71.02 | -1.10 |
20 Day MA | 71.81 | 0.27 | 70.28 | 0.37 |
50 Day MA | 70.48 | 0.54 | 69.17 | 0.47 |
100 Day MA | 67.65 | 0.39 | 66.72 | 0.36 |
4-Week High | 74.27 | 0.00 | 71.81 | 0.00 |
4-Week Low | 70.07 | 1.16 | 68.60 | 0.60 |
Technical Trend | Up | = | Up | = |
December 2021 cotton futures closed at 70.7 cents, down 0.74 cents since last Friday. Downside price protection could be obtained by purchasing a 71 cent December 2021 Put Option costing 5.4 cents establishing a 65.6 cent futures floor.
Wheat
Wheat net sales reported by exporters were down compared to last week with net sales of 16.4 million bushels for the 2020/21 marketing year. Exports for the same time period were up 32% from last week at 16.6 million bushels. Wheat export sales were 70% of the USDA estimated total annual exports for the 2020/21 marketing year (June 1 to May 31), compared to the previous 5-year average of 70%. Nationally the Crop Progress report estimated winter wheat condition at 46% good-to-excellent and 18% poor-to-very poor; and winter wheat emerged at 92% compared to 89% last week, 89% last year, and a 5-year average of 91%. In Tennessee, winter wheat condition was estimated at 68% good-to-excellent and 3% poor-to-very poor; winter wheat planted was estimated at 96% compared to 91% last week; and winter wheat emerged at 86% compared to 78% last week. March 2021 wheat futures closed at $5.75, down 31 cents since last Friday. March 2021 wheat futures traded between $5.74 and $6.09 this week. March wheat-to-corn price ratio was 1.37. Mar/May and Mar/Jul future spreads were 3 and 4 cents. May 2021 wheat futures closed at $5.78, down 31 cents since last Friday.
Wheat | Mar 21 | Change | Jul 21 | Change |
Price | $5.75 | -$0.31 | $5.79 | -$0.27 |
Support | $5.68 | -$0.26 | $5.72 | -$0.21 |
Resistance | $5.89 | -$0.24 | $5.91 | -$0.23 |
20 Day MA | $5.99 | -$0.06 | $5.99 | -$0.04 |
50 Day MA | $6.01 | $0.02 | $5.97 | $0.02 |
100 Day MA | $5.72 | $0.02 | $5.72 | $0.02 |
4-Week High | $6.28 | $0.00 | $6.19 | $0.00 |
4-Week Low | $5.74 | -$0.15 | $5.78 | -$0.08 |
Technical Trend | Down | = | Down | = |
In Tennessee, new crop wheat cash contracts ranged from $5.68 to $6.00. July 2021 wheat futures closed at $5.79, down 27 cents since last Friday. Downside price protection could be obtained by purchasing a $5.80 July 2021 Put Option costing 34 cents establishing a $5.46 futures floor.
Source : tennessee.edu