By Scott Irwin
Department of Agricultural and Consumer Economics
University of Illinois
A recent farmdoc daily article (June 10, 2021) reported estimates of the total acreage base, or size of the “acreage pie,” for the U.S. over 1998-2020. The total was relatively stable from 1998 through 2014, near the average of 359.4 million acres. However, there was a puzzling 14.4 million acre drop in total crop acreage after 2014. This trend was first noted in earlier farmdoc daily articles (April 2, 2015; January 21, 2016). The purpose of this article is to investigate what happened to the missing U.S. crop acres.
Analysis
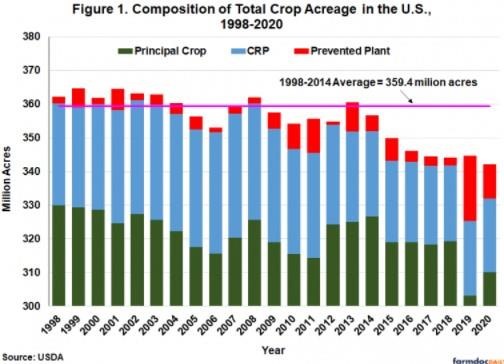
The process of estimating total U.S. crop land acreage was outlined in a farmdoc daily article from June 10th, 2021. Total crop acreage consists of three components: i) principal crop acreage, ii) Conservation Reserve Program (CRP) acreage, and iii) prevented plant acreage. Figure 1 presents each of the three components over 1998-2020. The top of the three bars represents the estimate of total crop land acres for the U.S. As noted above, the total was relatively stable over 1998-2014, varying by roughly +/- 5 million acres from the average of 359.4 million. It is interesting to observe that total crop acreage was essentially fixed during the ethanol boom years of 2007-2013. This makes the decline in total crop acreage after 2014 all the more puzzling. Total acreage declined from 356.7 million in 2014 to a low of 342.2 million in 2020, a decline of 14.4 million acres. The interesting question is what is behind this puzzling decline.
The first point to remember with regard to the decline is that the data used in Figure 1 to measure total crop acreage is inexact. Data for each component is collected by different agencies within the USDA and each agency uses somewhat different methods and definitions (see the farmdoc daily article from June 10th, 2021 for details). A single process that imposes an “adding up” constraint is not used by the USDA. Furthermore, each component is subject to sampling and non-sampling errors (farmdoc daily, April 4, 2014; April 9, 2014). Lastly, the coverage of states surveyed can change over time, particularly due to budgetary pressures.
While measurement error is an issue, it is doubtful that it has changed substantially over time, which means it is not likely to be helpful in understanding the decline in crop acres after 2014. We instead begin the analysis by comparing changes in CRP and principal crop plus prevented plant acreage. Given a relatively fixed total acreage base, the expectation is that the two series will move in opposite directions. That is, when acres go into the CRP this reduces the total for the other two components of crop acreage, and vice versa. As shown in Figure 2, this is roughly what happened between 1998 and 2007 when CRP increased by 6.6 million and the sum of principal crop and prevented plant decreased by 9.5 million. Just the opposite happened between 2007 and 2013, when CRP decreased by 9.9 million and the sum of principal crop and prevented plant increased by 11 million. During these two periods, the CRP effectively functioned as an acreage “buffer stock,” with acreage going into the CRP during the low price period and acreage coming out during the high price period.
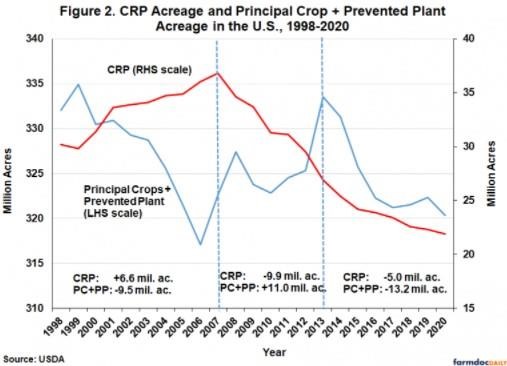
It is surprising then to see in Figure 2 that both CRP and principal crops plus prevented plant declined from 2013 through 2020. It should be noted that the decline in CRP, 5.0 million acres, was much smaller than the decline in principal crops plus prevented plant, 13.2 million acres. Nonetheless, this seems to suggest that the inverse relationship between the two series has broken down. Fortunately, the USDA tracked the subsequent use of the 7.6 million acres enrolled in the CRP that had contracts expire in 2013-2016 (Bigelow et. al, 2020). Of the acreage that was not re-enrolled in the CRP, 79 percent went back into annual crops, perennial forage crops, or perennial specialty crops. While this study did not completely overlap with the 2014-2020 period, it strongly suggests that the vast majority of the land coming out of the CRP in recent years went back into annual or perennial crops and forage. If this is in fact the case, it implies that the decline in principal crop plus prevented plant acreage over 2014-2020 was so large that it swamped the positive impact of acreage coming out of the CRP. In other words, the reason that total crop acreage declined after 2020 was an unusually sharp decline in principal crop plus prevented plant acreage, not a change in the “buffer stock” nature of CRP acreage.
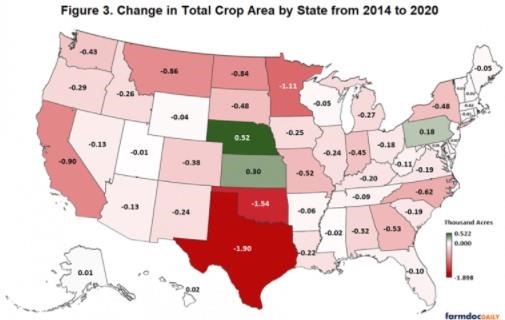
The next logical question, therefore, is to ask where the largest changes in total crop acreage occurred after 2014. In order to answer this question, we collected data for the three components of total crop acreage—principal crops, CRP, and prevented plant—on a state-by-state basis for 2014 and 2020. We then computed the change in total crop acreage between 2014 and 2020 for each state. Figure 3 maps the state changes in total crop acreage for these two years. Only four states showed increases in total crop acreage for this time period (Alaska, Kansas, Nebraska, and Pennsylvania). Every other state had a decrease in total acreage. The three states with the largest declines were Texas (-1.9 million), Oklahoma, (-1.5 million), and Minnesota (-1.1 million). Other states with relatively large declines included California, Montana, and North Dakota. The prevalence of Great Plains states in the group with the largest declines suggests that the loss of total crop acres may be concentrated in crops grown in this region.
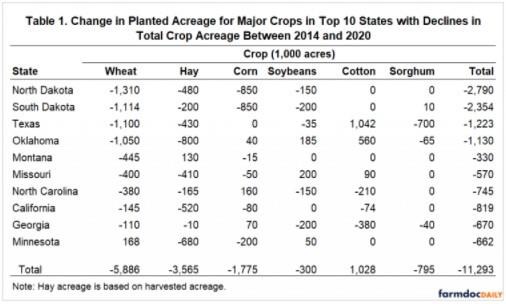
In order to drill down to the level of specific crops, we collected planted acreage data for major crops in the top 10 states with the largest declines in total crop acreage between 2014 and 2020. Table 1 presents the acreage data rank ordered by the change in wheat acreage (all types). The data reveal large declines in wheat and hay acreage, led by wheat acreage declines of at least a million acres in North Dakota, South Dakota, Texas, and Oklahoma. Only Minnesota had an increase in wheat acreage between 2014 and 2020 and it was less than 200,000 acres. The total decline for these 10 states in wheat planted acreage was 5.886 million acres and for hay acreage 3.565 million acres. There was also an aggregate drop in corn planted acreage in these 10 states of 1.775 million acres. However, this was concentrated in North and South Dakota which had a large number of corn prevented plant acres in 2020. The total decline in planted acreage for the 10 listed states was 11.293 million acres.
At this point, we know three facts: i) total crop acreage in the U.S. declined by 14.4 million acres between 2014 and 2020; ii) the decline in total crop acreage for this period was concentrated in the Great Plains; and iii) the principal crops that experienced the greatest declines in acreage within the Great Plains were wheat and hay. From this set of facts we can deduce that total crop acreage declined after 2014 mainly due to the loss of wheat and hay acreage in the Great Plains. It is important to recognize that this means that the wheat and hay acres were literally lost, in that they were not planted to other principal crops. We do not know exactly what happened to the missing wheat and hay acres—perhaps pasture, range, or fallow—but the data indicate they are not being used for the same purposes as before 2014. There is some evidence that increased fallowing of acres following severe drought may be one of the underlying drivers of the decline in total crop acreage (Smith, 2021). Decreased returns for wheat and hay production certainly also play a critical role.
It is important to emphasize that the conclusions drawn here are based on aggregate acreage data. Since this approach does not track individual acres over time there is the possibility that the aggregate data masks important changes in crop acreage. The only way to avoid this form of measurement error is to track every acre individually through time. This is actually possible (at least in theory) using the USDA Cropland Data Layer satellite data available here. Further analysis using the CDL would certainly help nail down exactly what happened to the missing crop acres after 2014. An interesting recent application of this approach to California crop acreage is found in Smith (2021).
Implications
After being stable for almost 15 years, total U.S. crop acreage declined by 14.4 million acres between 2014 and 2020. It is important to understand the fate of these lost crop acres, as the size of the overall “acreage pie” constrains the availability of acreage for individual crops. In this article, we show that: i) the decline in total crop acreage after 2014 was concentrated in the Great Plains, and ii) the principal crops that experienced the greatest declines in acreage within the Great Plains were wheat and hay. From these two facts we deduce that total crop acreage in the U.S. declined after 2014 mainly due to the loss of wheat and hay acreage in the Great Plains. We do not know exactly what happened to the missing wheat and hay acres—perhaps pasture, range, or fallow—but the data indicate they are not being used for the same purposes as before 2014. The results have two important implications for projections of U.S. crop acreage. First, the 14.4 million acres that went out of crop production after 2014 could presumably come back into production in the future, considerably expanding the total size of U.S. crop acreage. Second, the March USDA Prospective Plantings report indicates that U.S. farmers do not have plans to bring a substantial portion, if any, of these lost acres back into production in 2021. This is actually not overly surprising since bringing acreage back into production is a long-term investment decision that depends on lags relative to expectations of market returns. After all, it has not yet been a full year since the rally in grain prices began.
Source : illinois.edu