While farm numbers have dropped at the provincial level, the story is a bit more complicated when you examine the regional trends
By Nicholas Bannon and Alfons Weersink
Department of Food, Agriculture and Resource Economics
University of Guelph
Canada has less than 200,000 farms, according to the last census in 2016, and around 25 per cent of them are located in Ontario. The number of farms in Canada has fallen by approximately 75 per cent since the peak in 1941. Where are the remaining Ontario farms and is the rate of decline in farm numbers the same across the province?
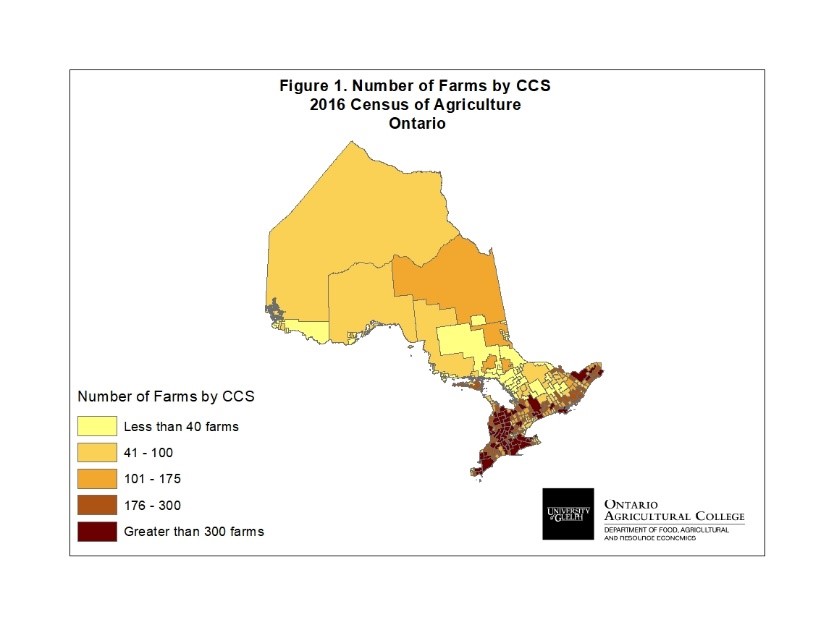
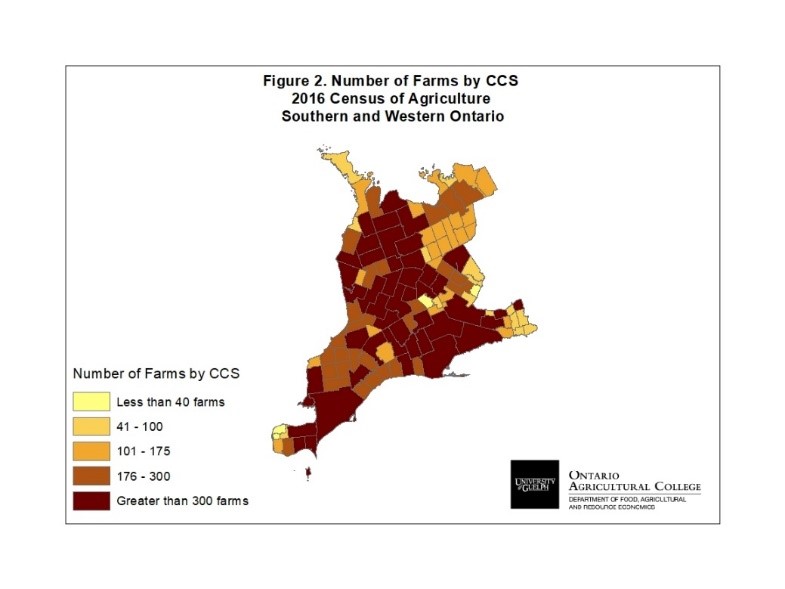
The location of the 50,000 Ontario farms by Census Consolidated Subdivision (CCS) are illustrated in Figure 1 for the province as a whole, in Figure 2 for Southern and Western Ontario, and in Figure 3 for Central and Eastern Ontario. The darker the colour, the greater the number of farms in the region.
Most of the province’s farms are clustered in Southwestern Ontario, with this region containing 67 per cent of all farms in Ontario. Central and Eastern Ontario has 29 per cent of farms and the remaining 4 per cent of farms are found in Northern Ontario. As of 2016, Chatham-Kent (Southern Ontario) is home to the greatest number of farms (2,211), and Lake of the Woods (Northern Ontario) is home to the fewest number of farms (5).
Note the maps do not adjust the number of farms per area, so regions with the same number of farms are coloured the same regardless of the farmland area in the region.
Also, note that the number of farms is based on the Stats Canada definition used in the census. A census farm is self-identified by the person answering the census. If the respondent feels that his or her farm operation has the potential to sell agricultural produce, the operation is classified as a farm. No minimum sales threshold exists, as the intention to sell farm produce is all that is necessary to be counted as a farm. Regardless of this self-reporting designation, the number of farms is highly correlated with agricultural sales.
The total number of farms in Ontario fell by approximately 5 per cent since the previous census in 2011. This drop is consistent with the steady percentage decline since 1941.
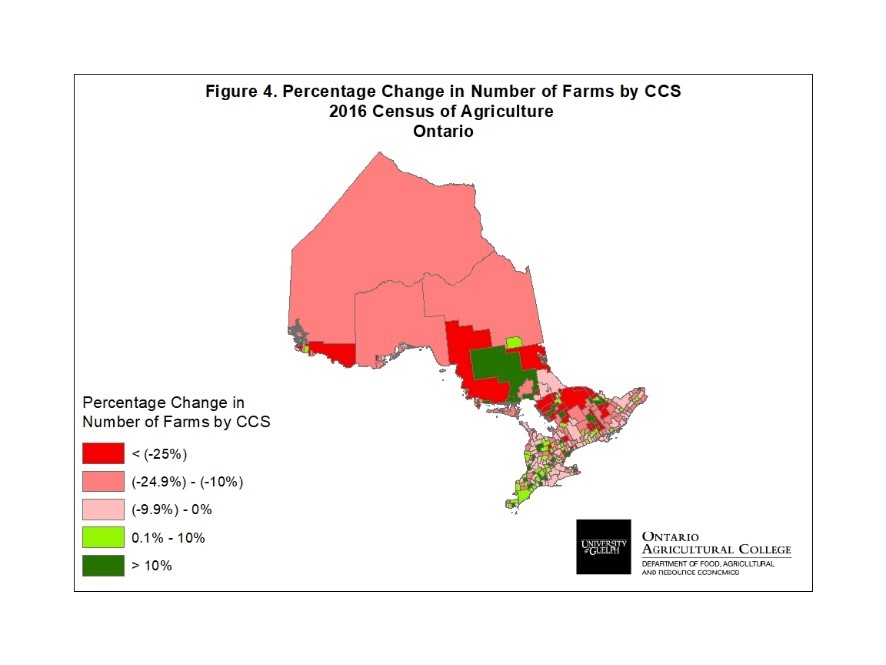
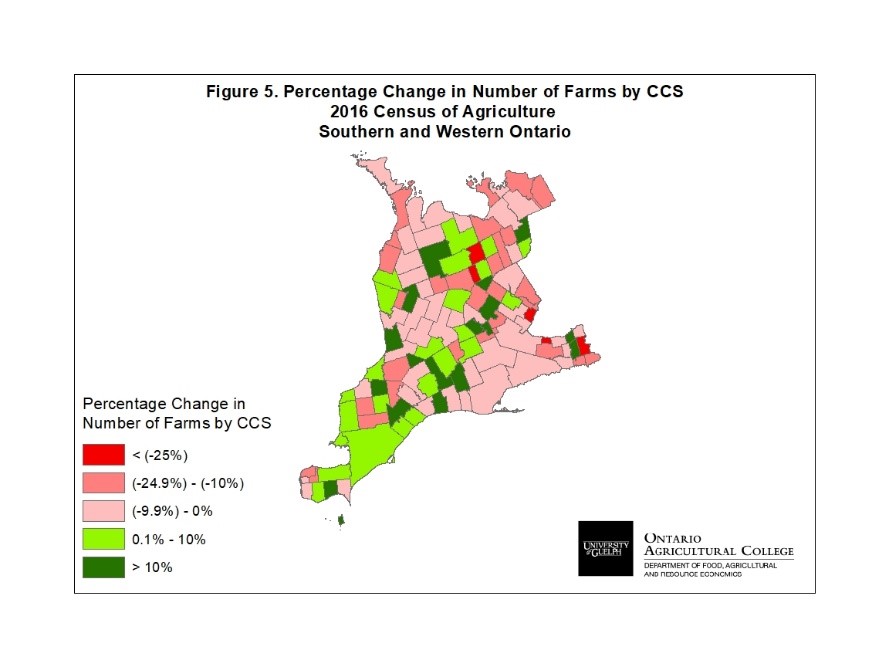
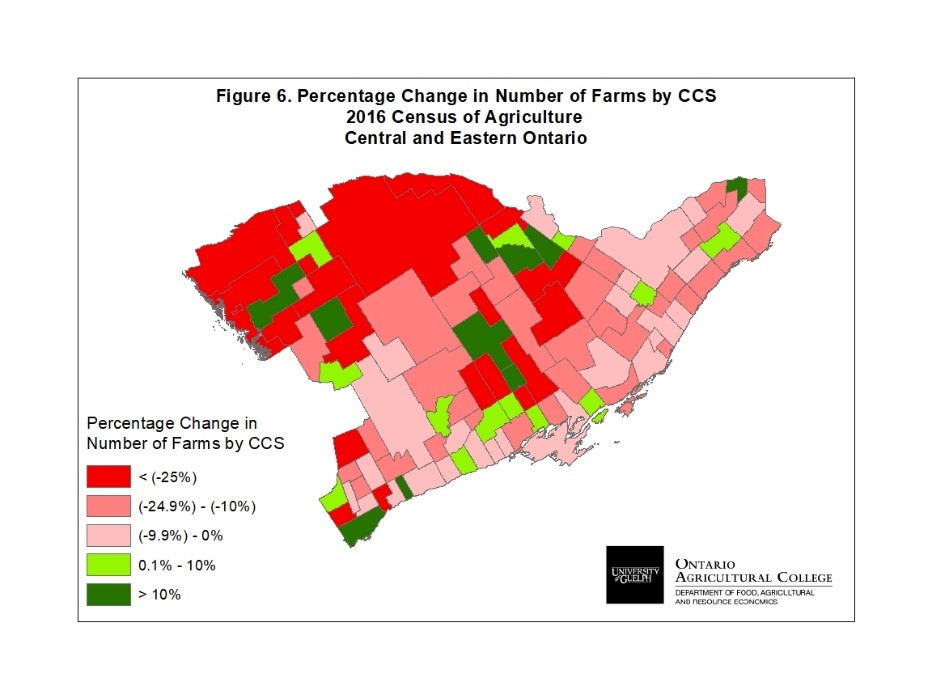
However, significant regional differences exist as illustrated in Figure 4 for the province, Figure 5 for Southern and Western Ontario, and Figure 6 for Central and Eastern Ontario. Red areas indicate the number of farms in the CCS has decreased and green highlights regions which experienced increases in farm numbers. The brighter the colour, the greater the change from the 2011 to the 2016 censuses.
Although Ontario experienced an overall decrease in the total number of farms since 2011, 74 (or 28 per cent of) Census Consolidated Subdivisions saw an increase in the number of farms. Just over half (54 per cent) of those areas are in Southern and Western Ontario. For example, the region of Chatham-Kent experienced an increase of 162 farms or 8 per cent. Of the 191 areas that experienced a decrease in farms, 43 per cent are in Central and Eastern Ontario. The Kawartha Lakes region, Central Ontario’s primary agricultural region, lost 101 farms – which equates to a 7 per cent decline – between 2011 and 2016.
To summarize, the total number of farms in Ontario fell between 2011 and 2016, which is a continuation of a long-term trend. Hidden behind the aggregate decline, however, is the net increase in farm numbers that many regions of the province experienced. Many of these regions that saw an increase are in Southern and Western Ontario, where much of Ontario’s agricultural industry is clustered. The increase in the number of farms in these regions is indicative of agriculture’s viability.
Sources:
Statistics Canada. Table 32-10-0403-01 Farms classified by farm type