Nationally, Canada has experienced a growth in cropland. Is this trend evident in Ontario, too?
Nicholas Bannon and Alfons Weersink
Department of Food, Agriculture and Resource Economics
Slightly less than 100 million acres of farmland in Canada are classified as cropland in the 2016 agricultural census. In total, 10 per cent of this cropland is in Ontario.
Cropland in Canada has increased by about 87 per cent since this data was first recorded in 1921. The figure also grew by 7 per cent between 2011 and 2016. Much of the growth in cropland can be attributed to the conversion of summerfallow, which is predominately a Western Canada farming practice, into cropland.
But does the national trend of increased amounts of cropland hold true in Ontario, where simmerfallow is less common?
An important distinction exists between cropland and total farmland. Statistics Canada considers cropland to only include field crops, vegetables, fruits, nursery crops and sod. Farmland, in contrast, includes all cropland, summerfallow, tame or seeded pasture and other land.
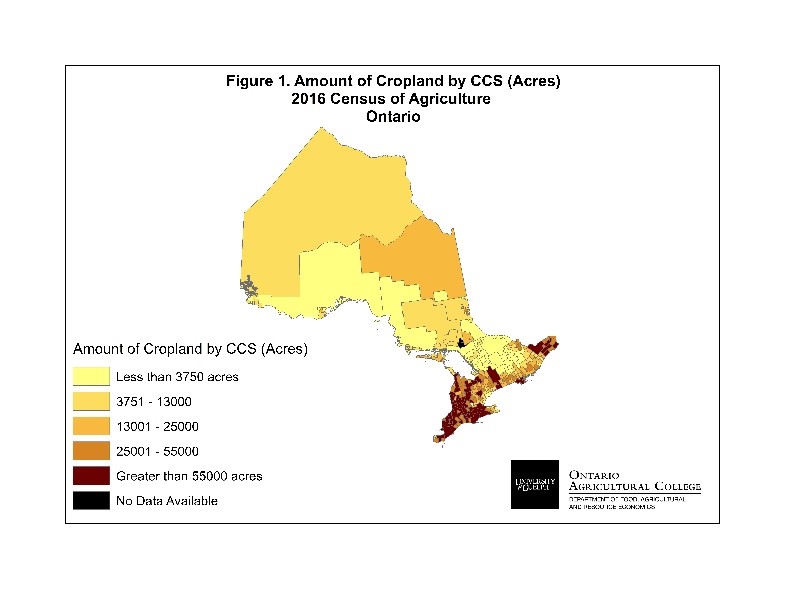
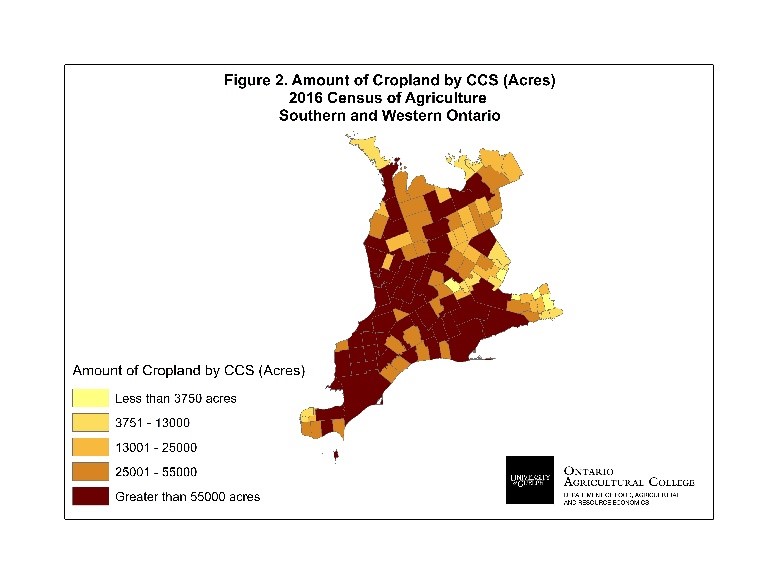
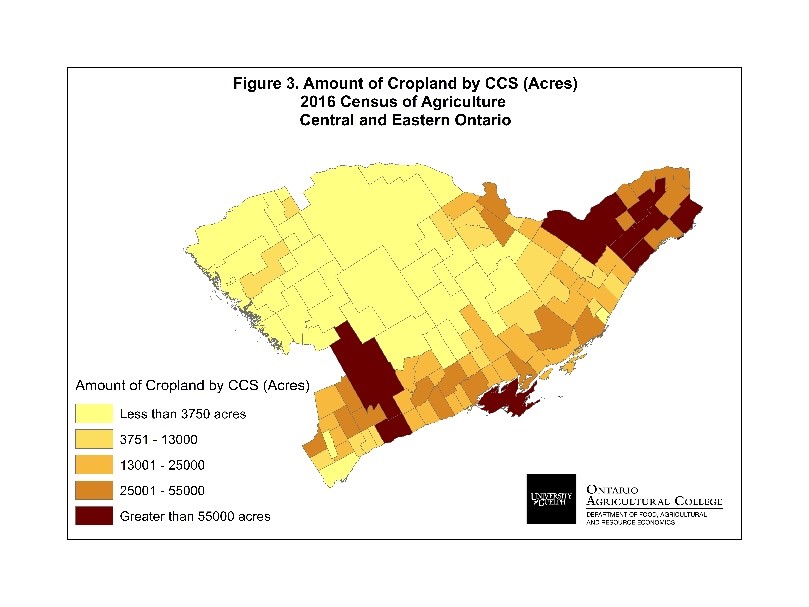
The location of Ontario’s 9 million acres of cropland by Census Consolidated Subdivision (CCS) is illustrated in Figure 1. Figure 2 shows southwestern Ontario and Figure 3 covers central and eastern Ontario. The darker the colour, the greater the amount of cropland in the region.
The majority (70 per cent) of Ontario’s cropland is in the southwestern portion of the province. Central and eastern Ontario have 26 per cent of the province’s cropland, while the remaining 4 per cent is in northern Ontario.
As of 2016, Chatham-Kent in southern Ontario had the most cropland (554,249 acres) of all Census Consolidated Subdivisions and Jocelyn in northern Ontario had the least (17 acres).
Unlike Canada, Ontario has not seen the same substantial increase in cropland. In fact, between 1921 and 2016, Ontario experienced a near 4 per cent decrease in cropland.
However, the most recent census shows that Ontario has reversed this long-term trend, as the province saw a 1 per cent or approximately 100,000-acre increase in cropland between 2011 and 2016. The next logical question to ask is if all areas across the province are experiencing similar rates of growth or if a discrepancy exists in growth between regions?
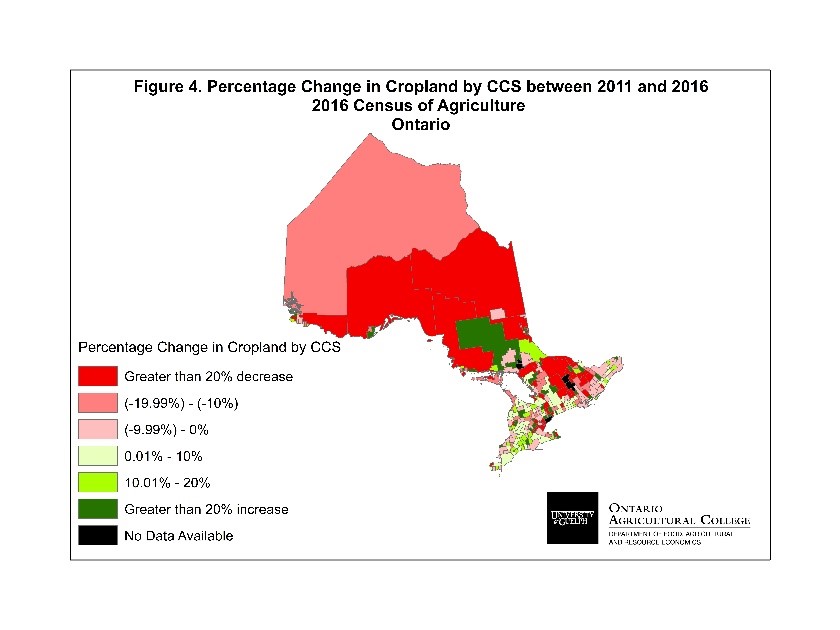
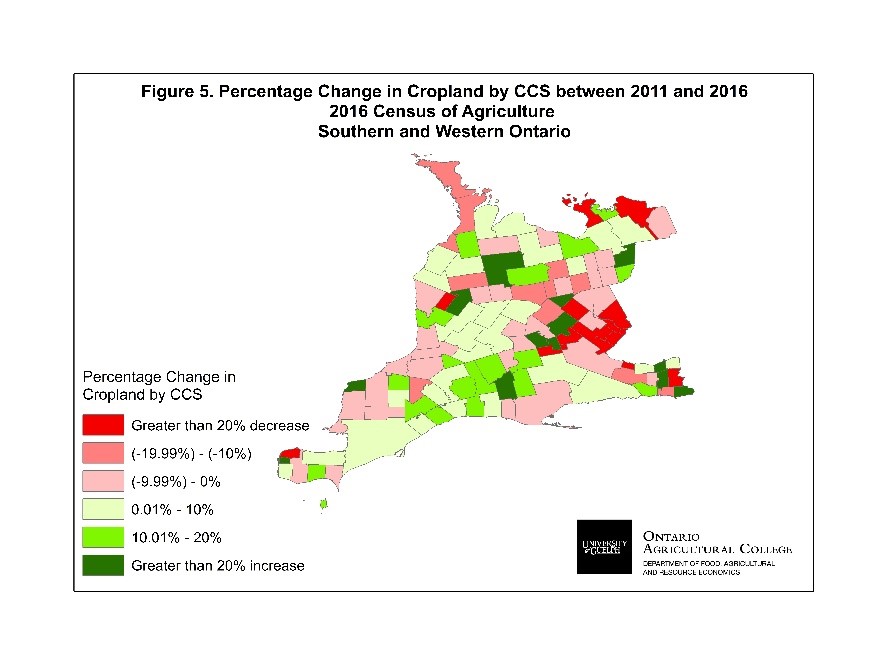
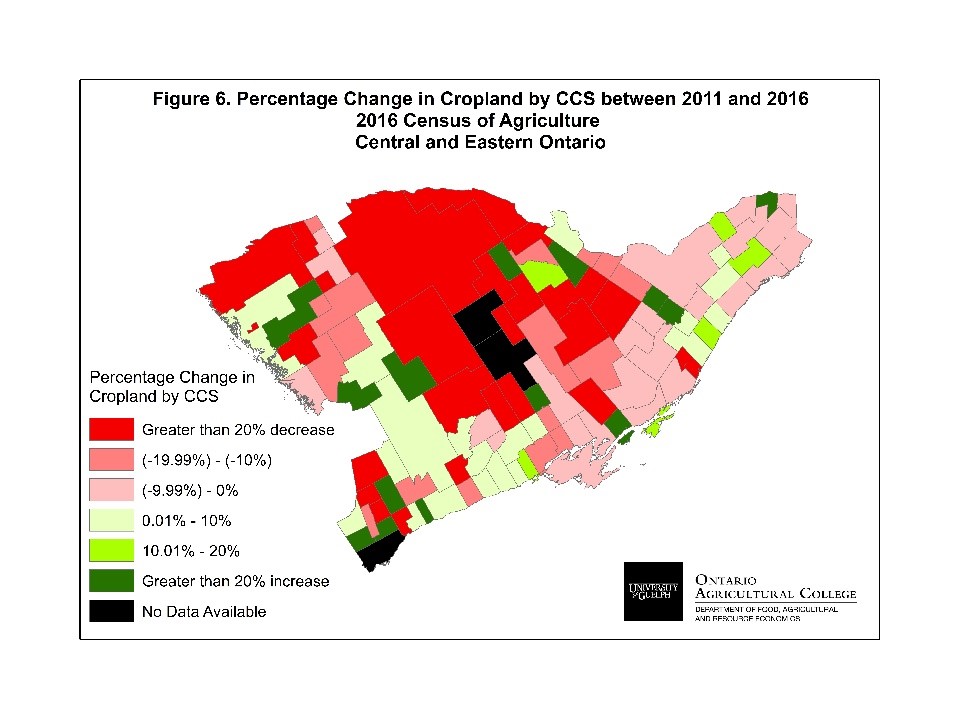
Figure 4 shows the percentage change in the amount of cropland by CCS across the province between 2011 and 2016. Shades of red represent a decrease in cropland, while shades of green represent an increase. Figures 5 and 6 focus on southwestern Ontario, and central and eastern Ontario, respectively.
If growth in cropland was uniform across all areas, all CCS regions on the map would be a light shade of green. But the maps show that growth in cropland between 2011 and 2016 differs significantly between regions.
Despite increases in total Ontario cropland, 57 per cent or 151 of Census Consolidated Subdivisions saw a decrease in cropland. In total, 42 per cent of these areas are in central and eastern Ontario. Whitchurch-Stouffville, for example, lost 6,171 acres or 31 per cent of its cropland between 2011 and 2016.
Much of Ontario’s growth in cropland occurred in southern Ontario, which saw an increase of 4 per cent or 130,752 acres between 2011 and 2016. Within this region, Fort Erie experienced the largest percentage increase of 62 per cent or 3,850 acres.
To summarize, between 2011 and 2016, notable regional disparities occurred in the changes to cropland area across Ontario. Large decreases in acreage happened in central and eastern Ontario, while large increases occurred in southwestern Ontario, where the majority of the province’s cropland is found.
Overall, Ontario experienced a smaller increase in the amount of cropland compared to Canada as a whole. The difference can likely be attributed to the significant conversion in western Canada of summerfallow into cropland.
Statistics Canada.?Table? 32-10-0153-01 ? Total area of farms and use of farm land, historical data