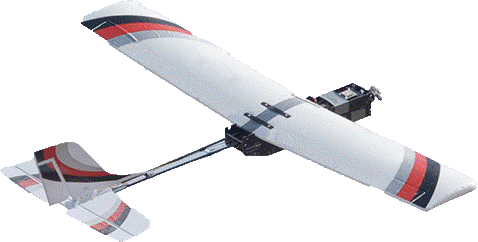
UAVs are getting a lot of publicity in the last couple of years. Do they add real value or is it yet another fad?
Is there real business value in UAVs and Precision Agriculture? More important, what is the cost / benefit of using them in your farming practice? Farms.com talked with Glen Schrader who is actively involved in numerous research projects involving remote sensing, increasing plant health & soil fertility, and increasing farm profitability. He also has both a B.Sc and MBA.
Vegetative indexes and “Precision Agriculture” have been the “Next Big Thing” since the 1970s. Have things changed? Schrader says “yes”. UAVs bring data acquistion costs down and can get you results sooner. New battery technologies let UAVs fly longer. Smart phone technology means that sensors and GPS systems are very small, very light weight, and low cost. Farm equipment can now read GPS data and the equipment is precise and automated enough to make precision agriculture applications practicle.
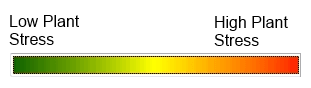
Remote sensing images may look cool, but do they add value? “It depends,” continues Schrader. “Images and alogorithms are not all created equal. In my opinion, an NDVI image is of little value to a farmer. However, a nutrient stress map offers a lot of value to the farmer.”
Low Value NDVI map| | 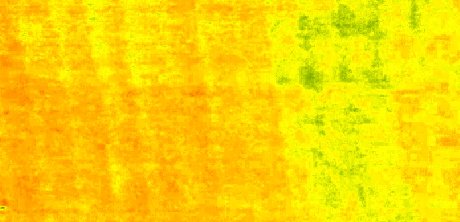 | |
| | 
| |
An NDVI image uses uses multiple spectral bands, including near infrared, to calculate and approximate plant health. While it does a good job of this, Schrader feel that it is not useful to farmers because it is too generic and it is not easy to determine the best course of action to remediate the plant stress. “It does not give a good indication of why some plants look healthier than others,” says Shchrader. In fact, it can lead to poor management decisions, such as fertilizing the lower left red areas in the image above.
This field has 3 major factors effecting plant growth, a higher plant population in the top third of the picture, more soil moisture in the right third of the picture, and various nitrogen levels. Schrader feels that a good precision ag system needs to look at very specific situations and make very specific recommendations.
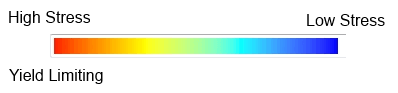
High Value Nitrogen Stress Map| | 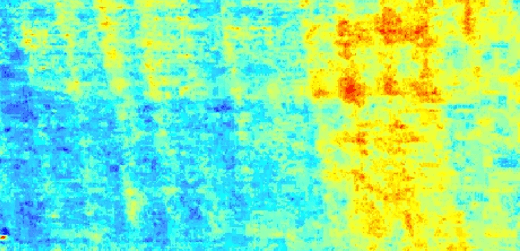 | |
| | 
| |
A nutrient stress map also uses multiple spectral bands, including near infrared. However, the calculations, spectral bands and other inputs are different. Moreover, it asks and answers a more specific question “Show me areas of the field where the plants look to be suffering high nitrogen stress.”
In the nutrient stress map, areas of high nitrogen stress can be identified by the 8-leaf stage in corn. These high stress areas are very likely to yield less then 50% of the harvest per unit area as the blue, low stress areas. A good precision ag system will let you identify nutrient stress early in season so that there is time to remediate the stress and give you a prescription map and recommendations so you can act on the information if you wish.
A danger with any of these maps is that there is a temptation to jump to conclusions. The maps are tools to help farmers understand what is happening in the field and help them make better informed decisions. Some people may look at the NDVI map and conclude the plants in the bottom left corner are stressed and therefor should get another application of “yet another chemical”, in this case, nitrogen fertilizer. More maps offer a better understanding of what is happening in the field and can lead to better crop management. Using our knowledge of the field, the NDVI, and the Nitrogen stress map, we can reasonably conclude the following:
- The corn plants in the lower left portion of the field were / are being limited by water. Adding extra nitrogen to them will not increase yield. Worse, it may actually decrease yield by increasing water stress.
- The plants on the right side of the map are growing very well. In fact they are growing so well that they have used up a lot of the available soil nitrogen and are now showing signs of nutrient stress. Adding extra nitrogen in this area early enough in the growing season will likely increase yield.
- It is easier to explain and manage large differences than small. For example, the blue and red zones in the nitrogen stress map. Intermediate values, such as yellows and greens are harder to explain accurately, thus harder to manage. More importantly, the amount of remediation and the ability to recovery of lost yield is limited.
In the nutrient stress map, areas shown in red and orange can benefit significantly from another application of nitrogen. With the right algorithms, visualizations, prescription maps, UAV, and at the right price, precision agriculture does add value and increase profit.
Is it a slam dunk or magic bullet? No. Is it worth consideration? Yes.