By Joe Janzen
Department of Agricultural and Consumer Economics
University of Illinois
The Russian invasion of Ukraine has been a major shock to agricultural commodity markets. Both Russia and Ukraine are major exporters of agricultural commodities, especially wheat and corn (see farmdoc daily February 28, 2022). War in Ukraine and international sanctions against Russia have already impeded the flow of agricultural commodities from the Black Sea region to world markets (See here).
This article describes crop price reaction to the conflict, including changes to the term structure of futures prices also known as the forward curve. The analysis shows that the conflict has affected price expectations both in near-term and longer-term. Prices for the current 2021/22 marketing year which ends this summer have risen the most, but prices for delivery in the 2022/23 marketing year are also higher. Crop price increases since the beginning of the conflict have been massive for winter wheat, large for both spring wheat and corn, and small for soybeans.
With expected prices higher in the short-run than the long run, the market rewards prompt movement of all available supplies to market. These supplies must come from existing inventories, at least until planting and production can respond with the next harvest. Given the timing of the conflict, winter wheat supplies are likely to be constrained longest as northern hemisphere acreage response cannot occur until the 2023 crop. This implies high wheat prices may persist for some time. Corn, soybean, and spring wheat prices are also elevated, but 2022 production outcomes are relatively uncertain. The market will be closely watching what gets planted where to assess how supply response might alleviate current high prices.
What Has Happened to Crop Prices?
Figure 1 shows prices for the nearby May 2022 futures contract for soft red winter (SRW) and hard red spring (HRS) wheats, corn, and soybeans since the beginning of the year. (For presentation, hard red winter wheat futures prices are omitted from figure 1, but their price history is similar to SRW wheat over this period.) Prices at the beginning of the year were already elevated due to strong global demand, high prices for inputs like fertilizer, and poor weather in some growing regions that lowered available supply. Both corn and soybean prices rose during January and February in response to dry conditions in South America which dramatically shrank corn and soybean crop estimates in Brazil and Argentina. Wheat was less affected by South American weather as this region is relatively less important for global wheat trade.
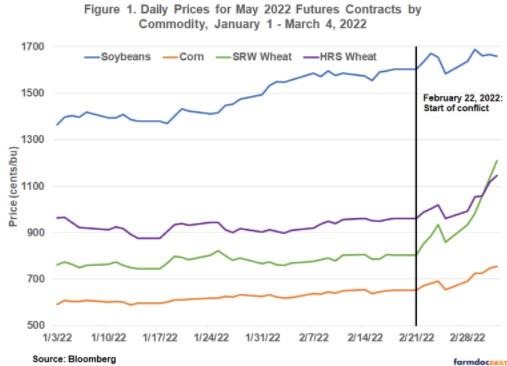
Prices for all commodities in Figure 1 increased beginning February 22 when Russia made initial steps to initiate military operations in Ukraine. Prices rose further during overnight trade on the evening of February 23 when President Putin announced a full-scale military invasion of Ukraine. This speech was released at 6am on February 24 in Moscow which was 9pm, February 23 in Chicago. The market reaction was swiftest and strongest in SRW wheat that market locked up the limit by 11pm Chicago time on February 23 and remaining up the limit throughout most of February 24.
Since this initial reaction, crop futures prices have continued to rise; as of March 4, the May 2022 SRW wheat futures price was up 50% since February 21, closing the week at $12.09/bu. In the last week, SRW futures hit price limits in nearby contracts nearly every day. May futures prices for spring wheat and corn have experienced smaller but similarly impactful increases of 19% and 16%, respectively. Meanwhile, soybean futures price levels, though volatile, have hardly moved in comparison with the May 2022 soybean futures contract up less than 4% since February 21.
Background on the Forward Curve
The commodity forward curve plots prices on a given date for futures contracts with different delivery dates. In a ‘normal’ market, the forward curve slopes upward to provide incentive to hold commodity inventories; prices for current (nearby) delivery are lower than for later (deferred) delivery in the distant future. A normal market promotes commodity storage to balance current supply and demand and buffer against future shortfalls. Prices tend to be low and stable relative to long-run average price levels and price volatility.
In the opposite case of an ‘inverted’ market, the forward curve slopes downward. Prices in the near-term are higher than for delivery later to encourage available inventory to be brought to market immediately. This is often in response to supply and demand shocks which have made the commodity scarce in the near-term. In inverted markets, commodity inventories are tight; prices tend to be higher and more variable than long-run average price levels and price volatility.
Inverted markets tend to first appear across marketing years. At the beginning of the marketing year, commodity supplies are replenished by a new harvest. Deferred prices for new crop delivery can be much lower than old crop prices as a result. The first futures contract for new crop delivery is often where an inverse is first observed. Spreads between new crop and old crop prices will be negative and the forward curve inverted if new crop production is expected to significantly alleviate commodity scarcity. If supply and demand conditions in the near term tighten further, prices all along the forward curve move to inverse to further disincentivize commodity storage.
Changes in Forward Curves since January 2022
Figure 2 shows the commodity forward curves for SRW wheat, HRS wheat, corn and soybeans in mid-January 2022, just prior to the Ukraine-Russia conflict on February 21, and at the close of trading on March 4. Prices are given for all futures delivery months until the end of 2023. This encompasses the old-crop 2021/22 marketing year, the new crop 2022/23 marketing year, and the beginning of the 2023/24 marketing year.
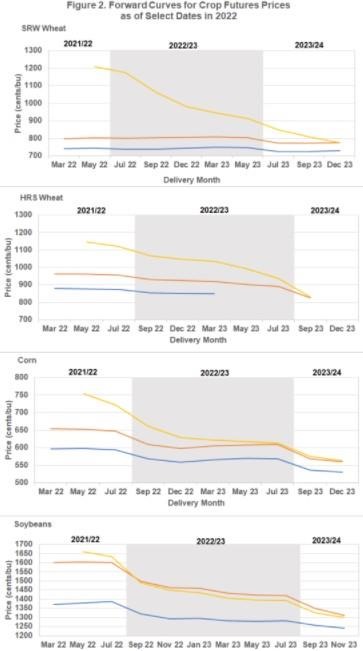
Prior to the market disruption caused by the war in Ukraine, inverses were seen between new crop and old crop futures for HRS wheat, corn, and soybeans. Strikingly, the forward curve for SRW wheat was relatively flat; new crop, 2022/23 prices were roughly equal to old crop, 2021/22 prices. This suggests two things: i) current global winter wheat acres were viewed by the market as insufficient to alleviate relatively tight old crop supply and demand conditions and/or ii) the market was alert to the possibility of new crop supply uncertainty related to the conflict in Ukraine which was rumored at that point.
Between mid-January and February 21, the shape of crop futures forward curves was little changed. Price levels increased, especially for soybeans and somewhat for corn, in response to the South American drought. Within a given marketing year, curves were still relatively flat. For corn, soybeans, and spring wheat, new crop supplies were expected to alleviate scarcity and lead to more normal market conditions.
It is important to note that the major difference between winter wheat and other spring-planted crops like corn, soybeans, and spring wheat is that winter wheat acreage cannot be adjusted for the new crop marketing year. The 2022 northern hemisphere winter wheat crop was planted last fall. As of now, the world wheat market has fewer means to respond to supply disruptions from this region. Thus prices for winter wheat must ration a relatively fixed supply across a long period. The bulk of the wheat crop in Ukraine and Russia is winter wheat. In contrast, high prices for corn, soybeans, and spring wheat can draw new acres into production (either from other crops or fallow land).
Between the onset of the war on February 22 and the end of last week, March 4, wheat and corn forward curves have moved from flat or small inverses to being very strongly inverted. Futures prices for delivery in the fall 2023 remain the roughly similar to their levels two weeks ago, but prices for each prior delivery month are higher and the forward curve is now fully inverted. This change is especially pronounced in SRW wheat. The average price difference (or the average slope) on the SRW wheat forward curve is currently negative 26 cents per bushel per month, or an inverse of about 2% of the nearby futures price. The average price differences along the HRS wheat, corn, and soybean forward curves are -1.5%, -1.2%, and -1.1% of the current nearby price respectively. As shown in figure 2, soybean futures prices have increased modestly at the front end of the curve and remained stable at later dates. Increases in corn futures prices have similarly been concentrated at the front end of the curve, though prices for delivery months throughout the 2022/23 marketing year are higher.
How long will these extreme market conditions persist? Prices can only decline and inverses return to normal when available supplies are adequate to both meet current demand and maintain robust inventories. Supply response in the form of increased planted acres and higher yields is the likely means by which this will occur. (Permanent inventory drawdowns in countries like China that maintain large stocks could also spur a move back to normal market conditions, but this is considerably less likely.)
Markets will closely watch spring planting intentions and crop conditions in the northern hemisphere over the next few months to see how well corn, soybean, and spring wheat supplies might respond to current high prices. For winter wheat, supply response cannot come quickly. The demand side of the market will seek alternatives and work to ration extremely scarce supplies, assuming the war continues to disrupt agricultural activity in Ukraine and interrupt the flow of commodities out of Black Sea ports into the 2022/23 marketing year.
Source : illinois.edu