By Carl Zulauf
Department of Agricultural, Environmental and Development Economics
Ohio State University
Nick Paulson and Krista Swanson et.al
Department of Agricultural and Consumer Economics
University of Illinois
The ad hoc Market Facilitation Program (MFP) compensated farms for the estimated loss of exports due to retaliatory tariffs placed on US farm exports by other countries in response to tariffs the US imposed on their exports to the US. The first MFP was for 2018 production of 9 commodities, including corn, cotton, sorghum, soybeans, and wheat (see Note 1). The USDA (US Department of Agriculture) report explaining the determination of 2018 MFP payments focused on trade damage. Historical base acres of these 5 crops were eligible for financial safety net protection through federal commodity programs, prompting the question, “Why make ad hoc payments to them?” This question is examined in this article. A commodity program coverage gap is proposed as a rationale. The gap was especially large for soybeans, arguably the crop most exposed to damage from a tariff war. Suggestions for reducing the coverage gap are discussed. Better alignment of program base acres with planted acres is a common theme.
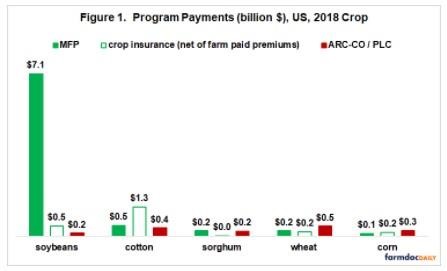
MFP 2018 Payments: Soybean MFP 2018 payments were 86% of all MFP 2018 payments (see Figure 1). They were also 60% of all payments to the 5 program commodities by MFP, ARC-CO (Agricultural Risk Coverage – County) commodity program, Price Loss Coverage (PLC) commodity program, and crop insurance net of farm-paid premiums (see Note 2). While a simplification, it is not unreasonable to characterize MFP 2018 as a soybean ad hoc program.
MFP Timeline: Tariff and counter-tariff announcements and negotiations occurred from March 1 to late May 2018 (Swanson, Coppess, and Schnitkey). Soybean prices oscillated but in late May were near March 1 values. They then began to slide as it became clear that a tariff war would happen.
Base Acres and Program Assistance: ARC-CO and PLC commodity programs pay on historical base acres, not current planted acres. This disconnect has been created to decouple program payments from planting decisions (i.e. reduce impact of payments on planting decisions). An acre planted to soybeans may thus be a base acre for wheat, corn, cotton, or other program commodity. While good reasons exist for decoupling, it can create issues when an event impacts program commodities differently than the support provided by commodity programs. A tariff war was likely to have a major impact on soybeans. Around half of production is exported, and China, a key US target in the tariff war, is the world’s largest importer of soybeans by far. Even if ARC-CO and PLC had made large payments, which did not happen (see Figure 1) due to other policy design issues; a large gap would have existed between the economic loss suffered by soybeans and commodity program payments. Decoupling has resulted in a large gap between soybean base and planted acres. The 2018 situation for the program commodities that received MFP 2018 payments is now explored in detail.
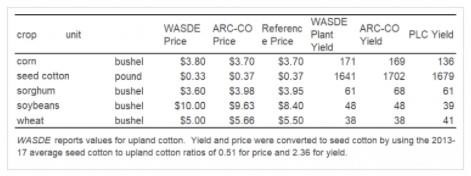
Program vs. Market Value Indicator: The following ratios were calculated to provide an indication of the value of ARC-CO and PLC quantity relative to the market value of 2018 production as projected in the May 11, 2018 WASDE’ (World Agricultural Supply and Demand Estimates). This WASDE predates the irrevocable impact of the tariff war on prices. “Indicator” is used because the ratio is not an exact measure of program quantity value but is designed to capture its main component (see Note 3). The calculation assumes ARC-CO or PLC is the only program (see Note 4). Thus, total US base and planted acres are used (see Note 5). ARC-CO and PLC do not pay on 15% of base acres, hence the 85% acre payment factor in the numerator.
ARC-CO vs. market value indicator = (2018 US base acres times 85% times ARC-CO revenue per acre) divided by (projected 2018 US production times projected US 2018 market year price)
- ARC-CO revenue per acre = 86% times (Olympic average (removes low and high) US yield per planted acre for 5 prior crops) times (Olympic average ARC-CO price for 5 prior crops)
- ARC-CO price for a year is higher of Olympic average price for 5 prior crops or reference price
- PLC vs. market value indicator = (2018 US base acres times 85% times PLC revenue per acre) divided by (projected 2018 US production times projected US 2018 market year price)
- PLC revenue per acre = (US average PLC payment yield) times (reference price)
Findings: Two stand out. First, both ARC-CO and PLC coverage indicator was markedly low for soybeans, both relative to 2018 expected market revenue and the other program commodities (see Figure 2). Second, even setting aside soybeans, program vs. market indicator varied: for ARC-CO from 81% (corn) to 141% (sorghum) and for PLC from 76% (corn) to 133% (sorghum). In short, the tariff war risk management value of ARC-CO and PLC varied notably by crop.
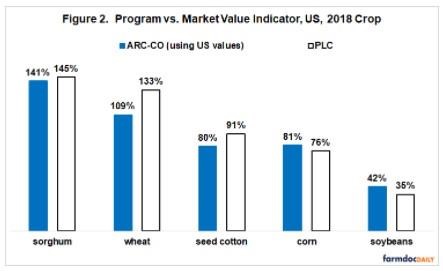
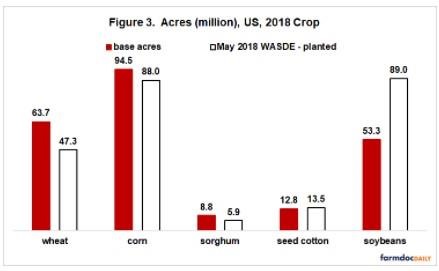
Base Acres: Program base acres were 36 million or 40% below acres expected to be planted to soybeans in 2018 (see Figure 3 and Note 6). Seed cotton also had fewer base than planted acres, but its difference was 5% or 0.7 million acres. If base acres had equaled planted acres, soybean’s program value relative to market value would have been 70% for ARC-CO and 58% for PLC.
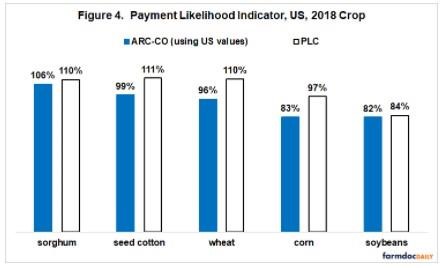
Payment Likelihood Indicator: Another reason was soybeans’ low likelihood of program payment. Soybean’s $8.40 reference price was 16% below its $10 May WASDE 2018 market year price. PLC’s likelihood of payment indicator was thus 84% (see Figure 4). ARC-CO revenue per acre was 18% below soybeans’ projected 2018 US revenue per acre, resulting in an 82% likelihood of payment indicator. Only ARC-CO corn had as low of a payment likelihood indicator. PLC was expected to make payments for 2018 seed cotton, sorghum, and wheat. ARC-CO payments were expected for 2018 sorghum. Payments were also likely for the other program-crop situations if a tariff war occurred since prices should decline provided other supply-demand factors remained the same.
Assessment
Two findings stand out. One is a large ARC-CO and PLC coverage gap for 2018 soybeans, both relative to soybean’s market value and relative to the other program commodities. Second, program coverage varied widely across the crops included in this study, even excluding soybeans.
The large coverage gap for soybeans provides an economic rationale both for ad hoc assistance for soybeans and for soybeans having received the overwhelming share of ad hoc 2018 MFP assistance.
Ad hoc farm assistance has often preceded changes in commodity programs or crop insurance. See the July 29, 2020 farmdoc daily for a discussion of changes in commodity programs.
Revising policy is a reasonable response for 2 reasons. First, ad hoc payments set a precedent for similar payments in similar situations in the future. Second, payments by ad hoc and existing programs can overlap. ARC-CO and PLC made $1.5 billion in 2018 payments to the 5 program commodities in this study. Analysis is needed to ascertain the size of overlap with MFP payments, but at least some overlap seems likely. The tariff war resulted in prices being lower than otherwise. Overlap seems especially likely for sorghum and wheat given high program value relative to market value and a high likelihood of payment prior to the tariff war.
Updating commodity program base acres to better reflect planted acres would materially reduce the ARC-CO / PLC coverage gap for soybeans. It would also materially reduce commodity program cost.
To illustrate potential cost savings. If the 2014 farm bill had set base acres at average 2004-13 planted acres, ARC-CO and PLC payments for 2014-18 program commodities would have been $2.8 billion less (see Note 7).
These cost savings can be used to reduce the large variation that exists between commodity program value and market value. Alternatives include:
- Raise soybean’s $8.40 reference price ▬ soybeans has by far the lowest PLC reference price vs. market price (see Figure 4; the July 8, 2020 farmdoc daily examines this issue in detail),
- Raise ARC-CO’s 86% coverage factor ▬ payment trigger is lower for ARC-CO than PLC, especially if market price is near or below the reference price (see Figure 4), and
- Raise PLC yields, especially for corn and soybeans, to increase PLC coverage (see Figure 2).
It is impossible to know if the proposed commodity program changes would have forestalled MFP in 2018. But, it does seem reasonable to suggest MFP would at least have been smaller, especially for soybeans. Overlapping payments would have been a more obvious issue. For example, base acres of 74.7 million (2004-2013 average planted acres) and a support price of $9.63 (100% of ARC-CO price for 2018) would have implied large payments to soybeans if a tariff war occurred.
Notes
- Other MFP 2018 commodities were milk, shelled almonds, fresh sweet cherries, and pork. MFP assistance was offered to 2019 production of 28 commodities, including the 9 in MFP 2018 (USDA, August 22, 2019).
- ARC-IC (ARC individual farm) is a 3rd commodity program. It was 1% of 2018 US base acres.
- For example, the role of payment caps and limits are not considered. This omission is likely more important for ARC-CO because per acre payment is capped at 10% of revenue.
- Selected 2018 crop year values
- The program with the highest program to market value was the program with the highest share of base acres except for wheat. ARC-CO’s share of all US base acres was 96% for soybeans, 92% for corn, and 54% for wheat. PLC’s share was 74% for seed cotton and 68% for sorghum.
- Base and planted acres diverge in part because Congress has given farmers an option to keep current base acres when it has authorized an update of base acres. Farmers have updated base only if it increased acres in program commodities expected to make the highest payment.
- Except for base acres, program parameters were the same as announced for 2018. Cotton, crambe, and sesame are not included. Cotton changed program in 2018 (generic base to seed cotton). National Agricultural Statistical Service does not report acres planted to crambe and sesame.
Source : illinois.edu