By Gary Schnitkey, Krista Swanson et.al
Department of Agricultural and Consumer Economics
University of Illinois
By Carl Zulauf
Department of Agricultural, Environmental and Development Economics
Ohio State University
Prices on 2021 harvest-time futures contracts are above $6.00 per bushel for corn and $14.00 per bushel for soybeans, well above most prices since 2013. Some farmers express concerns about price declines. We use a farmdoc web-based tool to arrive at a market-based assessment of potential price declines. This tool indicates a 9% chance that corn prices will decline by more than $2.00 per bushel and a 20% chance of soybean prices declining by more than $2.00 per bushel. Current market conditions indicate higher probabilities of price declines than implied by historical deviations. Still, there are excellent chances of higher-than-average prices this fall, and chances of much higher prices if yields shortfalls occur.
Corn Prices
The Price Discovery Tool on the farmdoc website allows a user to assess downside price risks for Chicago Mercantile Exchange (CME) contracts for both corn and soybeans (click here). Figure 1 shows the output for the Price Discovery Tool for the corn CME contract with a December 2021 expiration. This output was captured on Monday, May 10, 2021, when the price on the December 2021 contract was $6.09.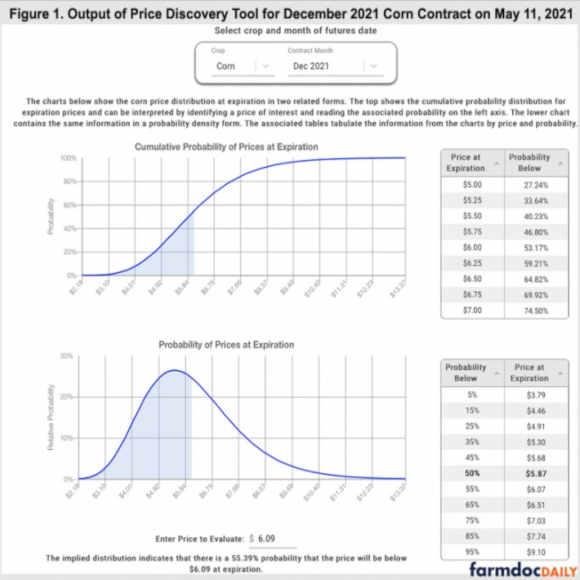
The Price Discovery Tool uses the current levels of futures and options prices to develop distributions of prices near the expiration of the contract. Well-tested option price models are used to develop price distributions. Possibilities of prices are given in four different formats including two graphs and two tables:
- A cumulative probability of prices at expiration (graph in upper left corner) shows prices along the horizontal axis and probability along the vertical axis. For a given price, the likelihood of being below the price is given on the vertical axis. The edge of the blue shaded area is the $6.09 price. There is a 55% chance that prices at harvest will be below $6.09. This also means there is a 45% likelihood corn prices at harvest will exceed $6.09. Higher prices could occur if there is a production shortfall due to a drought.
- Probability of prices at expiration (graph in lower left corner) shows a probability distribution. This is the standard representation of probabilities.
- The table in the upper right shows prices at expiration and then gives a “probability below”. At expiration, there is a 27.24% probability of being below $5.00 per bushel, a 33.64% probability of being below $5.25, and so on.
- The table in the lower right reverses the above presentation (given in 3). There is a 5% probability of being below $3.79, a 15% probability of being below $4.46, and so on.
On May 10, the price of the December 2021 contract was $6.09 per bushel, $1.51 higher than the $4.58 projected price used to set crop insurance guarantees. The Price Discovery Tool calculates a 17% likelihood of being below the projected price. Overall, the tool indicates:
- The chance of more than a $.50 decline from the $6.09 current price (i.e., a price of $5.59 or lower) is 43%.
- The chance of more than a $1.00 decline (i.e., below $5.09) is 30%.
- The chance of a more than $2.00 decline (i.e., below $4.09) is 9%.
Those probabilities are higher than those suggested by historical price changes. Figure 2 shows the yearly difference between the average settlement of the December contract in May minus the average settlement price in October. October was selected for this evaluation because that month is used to calculate the harvest price and settle revenue crop insurance contracts in the Midwest.
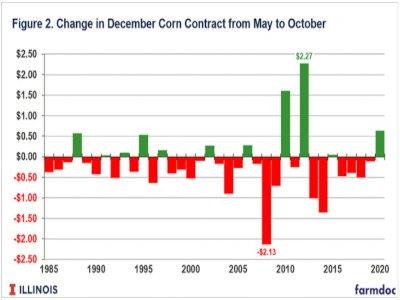
The following historical occurrence can be calculated using the prices differences from 1985 to 2020 shown in Figure 2:
- The historical occurrence of a $.50 or more price decline is 9 out of 36 years or 25% of the time. The 25% historical occurrence is less than the 43% chance from The Price Discovery Model.
- The historical occurrence of a $1.00 or more price decline is 3 out of 36 years or 8% of the time. The Price Discovery Model suggests a 30% chance of a $1.00 or more price decline.
- The historical occurrence of a $2.00 or more price decline is 1 out of 36 years or 3% of the time, compared to a 9% probability from The Price Discovery Model.
The Price Discovery Tool uses options prices in arriving at variability in prices, thereby providing a market-based assessment of price volatility. This year, options prices are much higher than in recent years, suggesting higher volatility relative to historical averages. For example, volatilities used to set crop insurance premiums were based on prices in the last five days of February. The 2021 volatility is .23, much higher than the .15 volatility in 2018 through 2020.
Soybeans
Figure 3 shows the Price Discovery Tool for the November 2021 soybeans captured on Monday, May 10, when the price of the futures contract was $14.14. The Price Discovery Tool indicates the following:
- The chance of more than a $.50 decline from the $14.14 current price (i.e., a price of $13.64 or lower) is 45%.
- The chance of more than a $1.00 decline (i.e., below $13.14) is 30%.
- The chance of a more than $2.00 decline (i.e., below $12.14) is 20%.
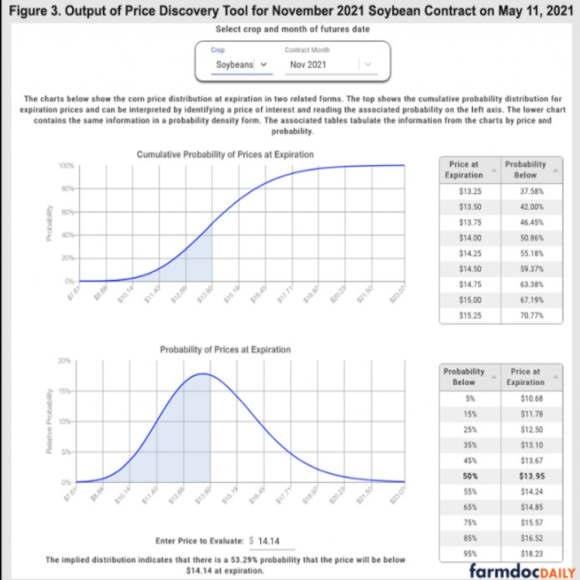
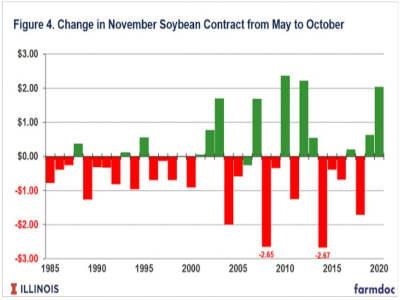
Figure 4 shows historical price changes for the years from 1985 to 2020, which imply the following:
- The historical occurrence of a $.50 or more price decline is 13 out of 36 years, or 39% of the time. The 39% historical occurrence is less than the 45% chance from The Price Discovery Model.
- The historical occurrence of a $1.00 or more price decline is 6 out of 36 years, or 17% of the time. The Price Discovery Model suggests a 30% chance of a $1.00 or more price decline.
- The historical occurrence of a $2.00 per bushel in 2 out of 36 years, or 6% of the time, compared to a 20% probability from The Price Discovery Model.
Similar to corn, soybean market conditions suggest more variability than historical occurrences. The crop insurance volatility for 2021 is .21, higher than all premiums since 2011.
Summary
Current market conditions suggest that downside price risks for 2021 are larger compared to recent years. This Price Discovery Tool indicates a 9% chance that corn prices will decline by more than $2.00 per bushel and a 20% chance of soybean prices declining by more than $2.00 per bushel. Still, the chances of having good prices in 2021 are high. Higher prices are possible if there are any yield shortfalls.
Source : illinois.edu