By Jeffrey Cluever and Julie Peterson
Introduction to Insect Degree-Day Models
It is critical for producers and crop consultants to know when an insect pest will be present in a damaging stage in the field. This knowledge enables more effective scouting and management decisions to be made. The use of calendar dates alone will not provide the accuracy necessary to make these decisions. This is because year to year variation in temperature can greatly affect insect development.
Degree-day models can provide a greater level of precision. Degree-days measure the amount of heat between an upper and lower threshold to which an insect has been exposed. Entomologists have developed models for several species of insects, including the western bean cutworm (WBC).
Each degree-day model is different; however, most models subtract the lower threshold from the average temperature for each day. For instance, if a certain day had a low of 55°F and a high of 70°F and our model has a lower threshold of 38°F and an upper threshold of 75°F, then the degree days would be:
[(70+55)/2]-38
[125/2] – 38 = 24.5°F degree-days
Note: If the average temperature is less than the lower threshold (38°F), then replace the average temperature with the lower threshold. If the average temperature is greater than the upper threshold (75°F), then replace the average temperature with the upper threshold prior to subtracting the lower threshold.
Western Bean Cutworm Degree-Day Model
The most recent model for predicting WBC flight was published by University of Nebraska-Lincoln entomologists (Robert Wright and Tom Hunt) and University of Minnesota entomologists (Roger Moon, Bill Hutchison and Anthony Hanson). This model shows that simple degree-days are best for predicting WBC flight. In this model, a lower threshold of 38°F and an upper threshold of 75°F are used starting on March 1. Twenty-five percent of WBC flight occurs when 2,577 degree-days Fahrenheit are reached (Table 1). This is the time when field scouting of corn should occur. In dry bean, use pheromone traps in lieu of scouting and make insecticide applications 10-21 days after peak flight if necessary. See NebGuide by Seymour et al. 2004 for more information.
Table 1. Relationship between WBC flight and accumulated degree-days| % WBC Flight | °Days F (±95% Confidence Interval) |
|---|
| 5 | 2,377 (1,843 - 3,066) |
| 10 | 2,456 (2,147 – 2,809) |
| 25 | 2,577 (2,416 – 2,749) |
| 50 | 2,704 (2,577 – 2,838) |
| 75 | 2,838 (2,660 – 3,027) |
| 90 | 2,977 (2,603 – 3,046) |
| 95 | 3,077 (2,385 – 3,968) |
Predicted Dates of 2021 WBC Flight for Nebraska and Nearby States
The predicted dates for WBC flight (Table 2) and corn development (Figure 1) are approximately the same as 2020. The growth stage of corn is crucial as WBC moths prefer to lay eggs on corn plants between the late whorl and early tassel stages. WBC larvae have increased survival if they can feed upon a freshly emerged tassel before moving to the ears.
Also consider using UNL’s AgriTools mobile app for Apple or Android. This application has a feature that will calculate degree-days for your location.
Temperatures were taken from High Plains Regional Climate Center (HPRCC) or National Oceanic and Atmospheric Administration (NOAA) weather stations for March 1 to June 16. To predict dates after June 16, the nine-year (2012-2020) average was used. If a weather station did not have data for a particular year , a weather station fewer than 10 miles away was used. If one was not present, then the average of three nearby weather stations was used. Note that two sources of error exist. 1) Error in predicted temperatures of dates after June 16 and 2) error intrinsic to the model itself (Table 1). As an example of the first source of error, in 2020 we predicted that 25% peak fight would occur on July 16 at Oakland, but according to the model it actually occurred on July 17 (See Table 3). Current degree-day accumulation may be found on the University of Nebraska-Lincoln’s Mesonet website. (Select “Western Bean cutworm GDD” from the drop-down menu).
Table 2. Predicted dates of WBC flight for various locations across Colorado, Iowa, Nebraska, Kansas, South Dakota and Wyoming| Municipality | Coordinates | Elev. | 5% | 10% | 25% | 50% | 75% | 90% | 95% |
|---|
| Alliance, NE | 42.17 -102.93 | 4072 | 19-Jul | 21-Jul | 25-Jul | 28-Jul | 1-Aug | 6-Aug | 9-Aug |
| Ainsworth, NE | 42.57 -99.83 | 2500 | 10-Jul | 12-Jul | 16-Jul | 19-Jul | 23-Jul | 27-Jul | 30-Jul |
| Alda, NE | 40.88 -98.52 | 1923 | 2-Jul | 4-Jul | 8-Jul | 11-Jul | 15-Jul | 19-Jul | 21-Jul |
| Ames, IA | 42.1 -93.58 | 1007 | 2-Jul | 4-Jul | 7-Jul | 11-Jul | 14-Jul | 18-Jul | 21-Jul |
| Arthur, NE | 41.45 -101.72 | 3589 | 14-Jul | 17-Jul | 20-Jul | 23-Jul | 27-Jul | 31-Jul | 3-Aug |
| Axtell, NE | 40.52 -99.05 | 2198 | 4-Jul | 6-Jul | 9-Jul | 13-Jul | 17-Jul | 20-Jul | 23-Jul |
| Big Springs, NE | 41.15 -102.00 | 3701 | 11-Jul | 14-Jul | 17-Jul | 20-Jul | 24-Jul | 28-Jul | 31-Jul |
| Broadwater, NE | 41.68 -102.87 | 4117 | 16-Jul | 19-Jul | 22-Jul | 25-Jul | 29-Jul | 2-Aug | 5-Aug |
| Brule. NE | 41.02 -101.97 | 3474 | 10-Jul | 13-Jul | 16-Jul | 19-Jul | 23-Jul | 27-Jul | 30-Jul |
| Central City, NE | 41.10 -98.05 | 1713 | 3-Jul | 5-Jul | 9-Jul | 12-Jul | 16-Jul | 20-Jul | 22-Jul |
| Clay Center, KS | 39.42 -97.15 | 1273 | 26-Jun | 29-Jun | 2-Jul | 5-Jul | 9-Jul | 13-Jul | 15-Jul |
| Columbus, NE | 41.46 -97.33 | 1450 | 1-Jul | 3-Jul | 6-Jul | 10-Jul | 13-Jul | 17-Jul | 20-Jul |
| Concord, NE | 42.38 -96.97 | 1545 | 7-Jul | 9-Jul | 12-Jul | 16-Jul | 20-Jul | 23-Jul | 27-Jul |
| Cozad, NE | 40.97 -99.95 | 2562 | 11-Jul | 13-Jul | 17-Jul | 20-Jul | 24-Jul | 28-Jul | 31-Jul |
| Douglas, WY | 42.8 -105.45 | 4892 | 26-Jul | 29-Jul | 1-Aug | 5-Aug | 10-Aug | 14-Aug | 17-Aug |
| Dunning, NE | 41.9 -100.17 | 2782 | 12-Jul | 14-Jul | 17-Jul | 21-Jul | 24-Jul | 28-Jul | 31-Jul |
| Elgin, NE | 41.93 -98.2 | 2064 | 6-Jul | 8-Jul | 12-Jul | 15-Jul | 19-Jul | 23-Jul | 26-Jul |
| Emmet, NE | 42.47 -98.77 | 2011 | 8-Jul | 10-Jul | 13-Jul | 17-Jul | 20-Jul | 24-Jul | 27-Jul |
| Firth, NE | 40.57 -96.62 | 1381 | 28-Jun | 30-Jun | 3-Jul | 6-Jul | 10-Jul | 14-Jul | 17-Jul |
| Fordyce, NE | 42.75 -97.35 | 1460 | 4-Jul | 7-Jul | 10-Jul | 13-Jul | 17-Jul | 21-Jul | 23-Jul |
| Ft. Collins, CO | 40.58 -105.15 | 1543 | 19-Jul | 21-Jul | 25-Jul | 29-Jul | 2-Aug | 6-Aug | 9-Aug |
| Ft. Pierre, SD | 44.12 -100.30 | 2274 | 11-Jul | 13-Jul | 17-Jul | 20-Jul | 24-Jul | 28-Jul | 31-Jul |
| Garden City, KS | 37.98 -100.82 | 2841 | 28-Jun | 30-Jun | 3-Jul | 7-Jul | 10-Jul | 14-Jul | 17-Jul |
| Gordon, NE | 42.75 -102.18 | 3652 | 19-Jul | 21-Jul | 24-Jul | 28-Jul | 1-Aug | 5-Aug | 8-Aug |
| Gothenburg, NE | 40.95 -100.20 | 2628 | 8-Jul | 10-Jul | 14-Jul | 17-Jul | 21-Jul | 25-Jul | 27-Jul |
| Grant, NE | 40.85 -101.72 | 3402 | 11-Jul | 13-Jul | 17-Jul | 20-Jul | 24-Jul | 28-Jul | 31-Jul |
| Guide Rock, NE | 40.08 -92.28 | 1742 | 29-Jun | 1-Jul | 5-Jul | 8-Jul | 12-Jul | 15-Jul | 18-Jul |
| Harvard, NE | 40.57 -98.15 | 1824 | 2-Jul | 5-Jul | 8-Jul | 12-Jul | 15-Jul | 19-Jul | 22-Jul |
| Hayes Center, NE | 40.55 -101.03 | 3064 | 8-Jul | 10-Jul | 14-Jul | 17-Jul | 21-Jul | 24-Jul | 27-Jul |
| Holdredge, NE | 40.5 -99.37 | 2323 | 5-Jul | 7-Jul | 10-Jul | 14-Jul | 17-Jul | 21-Jul | 24-Jul |
| Holyoke, CO | 40.48 -102.10 | 3694 | 12-Jul | 14-Jul | 18-Jul | 21-Jul | 25-Jul | 29-Jul | 1-Aug |
| Idalia, CO | 39.72 -102.32 | 3930 | 9-Jul | 11-Jul | 14-Jul | 18-Jul | 22-Jul | 25-Jul | 28-Jul |
| Kearney, NE | 40.72 -99.02 | 2129 | 3-Jul | 5-Jul | 8-Jul | 12-Jul | 16-Jul | 19-Jul | 22-Jul |
| Keystone, NE | 41.18 -101.65 | 1033 | 10-Jul | 12-Jul | 15-Jul | 19-Jul | 22-Jul | 26-Jul | 29-Jul |
| Lamar, CO | 37.97 -102.60 | 3734 | 2-Jul | 4-Jul | 8-Jul | 11-Jul | 15-Jul | 19-Jul | 21-Jul |
| Lexington, NE | 40.72 -99.75 | 2385 | 5-Jul | 7-Jul | 11-Jul | 14-Jul | 18-Jul | 22-Jul | 24-Jul |
| Lingle, WY | 42.13 -104.38 | 4186 | 20-Jul | 22-Jul | 26-Jul | 29-Jul | 2-Aug | 7-Aug | 10-Aug |
| Lincoln, NE | 40.72 -96.62 | 1394 | 27-Jun | 29-Jun | 3-Jul | 6-Jul | 10-Jul | 13-Jul | 16-Jul |
| Manhattan, KS | 39.2 -96.6 | 1050 | 24-Jun | 26-Jun | 29-Jun | 2-Jul | 6-Jul | 10-Jul | 12-Jul |
| Memphis, NE | 41.15 -96.42 | 1145 | 30-Jun | 2-Jul | 5-Jul | 9-Jul | 12-Jul | 16-Jul | 19-Jul |
| Merna, NE | 41.45 -99.78 | 2641 | 11-Jul | 13-Jul | 16-Jul | 20-Jul | 24-Jul | 28-Jul | 31-Jul |
| Mitchell, NE | 41.95 -103.70 | 4114 | 15-Jul | 17-Jul | 20-Jul | 24-Jul | 27-Jul | 1-Aug | 3-Aug |
| Mullen, NE | 42.45 -100.90 | 3091 | 13-Jul | 16-Jul | 19-Jul | 22-Jul | 26-Jul | 30-Jul | 2-Aug |
| Naper, NE | 42.83 -99.27 | 2001 | 9-Jul | 11-Jul | 14-Jul | 18-Jul | 21-Jul | 25-Jul | 28-Jul |
| Nebraska City, NE | 40.70 -95.90 | 1079 | 26-Jun | 28-Jun | 2-Jul | 5-Jul | 9-Jul | 12-Jul | 15-Jul |
| North Platte, NE | 41.08 -100.78 | 2841 | 10-Jul | 12-Jul | 16-Jul | 19-Jul | 23-Jul | 26-Jul | 30-Jul |
| Oakland, NE | 41.83 -96.55 | 1348 | 2-Jul | 5-Jul | 8-Jul | 11-Jul | 15-Jul | 19-Jul | 21-Jul |
| Ord, NE | 41.62 -98.95 | 2060 | 9-Jul | 12-Jul | 15-Jul | 18-Jul | 22-Jul | 26-Jul | 29-Jul |
| Oshkosh, NE | 41.48 -102.35 | 3763 | 11-Jul | 13-Jul | 17-Jul | 20-Jul | 24-Jul | 27-Jul | 31-Jul |
| Ragan, NE | 40.32 -99.38 | 2300 | 3-Jul | 5-Jul | 9-Jul | 12-Jul | 16-Jul | 20-Jul | 22-Jul |
| Scandia, KS | 39.82 -97.85 | 1480 | 2-Jul | 4-Jul | 7-Jul | 10-Jul | 14-Jul | 18-Jul | 21-Jul |
| Scottsbluff, NE | 41.88 -103.68 | 3934 | 15-Jul | 18-Jul | 21-Jul | 24-Jul | 28-Jul | 1-Aug | 4-Aug |
| Sidney, NE | 41.22 -103.03 | 4331 | 18-Jul | 20-Jul | 23-Jul | 27-Jul | 31-Jul | 4-Aug | 7-Aug |
| Smithfield, NE | 40.57 -99.70 | 2530 | 7-Jul | 9-Jul | 12-Jul | 16-Jul | 19-Jul | 23-Jul | 26-Jul |
| Sparks, NE | 43.00 -100.20 | 2520 | 12-Jul | 15-Jul | 18-Jul | 21-Jul | 25-Jul | 29-Jul | 1-Aug |
| St. Francis, KS | 39.62 -101.82 | 3661 | 9-Jul | 11-Jul | 15-Jul | 18-Jul | 22-Jul | 26-Jul | 28-Jul |
| York, NE | 40.87 -97.63 | 1637 | 30-Jun | 2-Jul | 6-Jul | 9-Jul | 13-Jul | 17-Jul | 19-Jul |
| Washington, KS | 39.77 -97.07 | 1368 | 27-Jun | 29-Jun | 2-Jul | 5-Jul | 9-Jul | 13-Jul | 16-Jul |
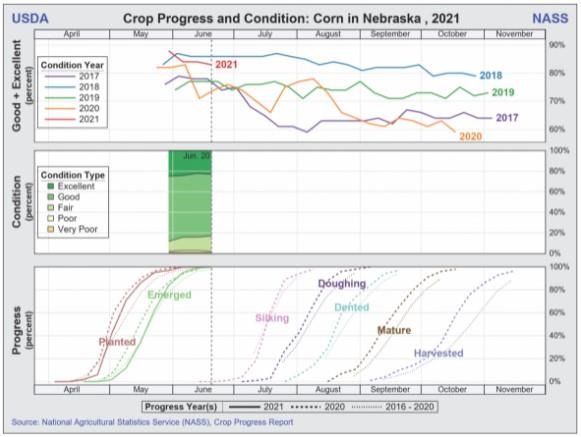 Figure 1. Corn Progress in Nebraska
Western Bean Cutworm Scouting and Management
The western bean cutworm is a primary pest of corn and dry edible bean. Problems with WBC are greater in areas with sandy soils. Previous studies have shown that one larva per plant can cause a 3.7 to 15.1 bushel per acre yield loss in corn.
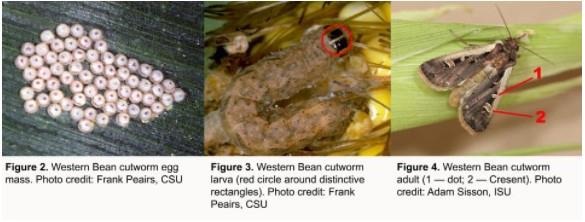
Western bean cutworm eggs may be found on the upper surfaces of corn and lower surfaces of dry bean leaves. Eggs may be found in masses of five to 200; however, the average is 50-85 . Freshly laid eggs are white (Figure 2). However, they will gradually turn darker during their five- to seven-day development. The larvae will consume their eggshells shortly after hatching. Late instar larvae may be distinguished by two dark, rectangular spots behind their head (Figure 3). Adult moths are approximately ¾ of an inch long by 1 ½ inch wide. The most distinguishing feature is a white band on anterior margin of the forewing. Behind this band is a white circle (located ½ of the way down the wing) and a white crescent (located 2/3 of the way down the wing) (Figure 4).
The threshold for corn varieties that lack effective traits against WBC is 5-8% of plants with egg mass or larvae. For dry edible beans, scouting is not practical, so pheromone traps are used. If fewer than 700 WBC moths are caught until peak, the risk is low; if more than 700 but fewer than 1,000 moths are caught, the risk is moderate; and if more than 1,000 moths are caught, the risk is high. Pheromone traps should be installed prior to the predicted 5% flight (late June to early July).
For an in-depth description of WBC, please see the Nebraska Extension publication Western bean cutworm in corn and dry beans, the Colorado extension publication Western bean cutworm: characteristics and management in corn and dry beans, or the Nebraska Perspective on efficacy of Cry1F Bt corn against western bean cutworm.
Table 3. Degree to which 2020’s predictions were off compared to actual flights.| Location | Coordinates | Predicted 25% flight for 2020 | Actual 25% flight for 2020 | Difference (days) |
|---|
| Ainsworth, NE | 42.57 -99.83 | 18-Jul | 18-Jul | 0 |
| Alda, NE | 40.88 -98.52 | 12-Jul | 12-Jul | 0 |
| Axtell, NE | 40.52 -99.05 | 11-Jul | 12-Jul | 1 |
| Big Springs, NE | 41.15 -102.00 | 17-Jul | 16-Jul | -1 |
| Brule, NE | 41.02 -101.97 | 15-Jul | 15-Jul | 0 |
| Concord, NE | 42.38 -96.9 | 16-Jul | 15-Jul | -1 |
| Cozad, NE | 40.97 -99.95 | 18-Jul | 18-Jul | 0 |
| Douglass, WY | 42.80 -105.45 | 1-Aug | 30-Jul | -2 |
| Elgin, NE | 41.93 -98.20 | 15-Jul | 15-Jul | 0 |
| Fordyce, NE | 42.75 -97.35 | 14-Jul | 14-Jul | 0 |
| Harvard, NE | 40.57 -98.15 | 11-Jul | 11-Jul | 0 |
| Holyoke, CO | 40.48 -102.10 | 16-Jul | 16-Jul | 0 |
| Kearney, NE | 40.72 -99.02 | 12-Jul | 12-Jul | 0 |
| Lincoln, NE | 40.75 -96.68 | 5-Jul | 5-Jul | 0 |
| Memphis, NE | 41.15 -96.45 | 9-Jul | 9-Jul | 0 |
| Merna, NE | 41.45 -99.78 | 18-Jul | 18-Jul | 0 |
| Mitchell, NE | 41.95 -103.70 | 18-Jul | 18-Jul | 0 |
| Nebraska City, NE | 40.70 -95.90 | 6-Jul | 6-Jul | 0 |
| North Platte, NE | 41.08 -100.78 | 15-Jul | 15-Jul | 0 |
| Oakland, NE | 41.83 -96.55 | 16-Jul | 17-Jul | 1 |
| Scottsbluff, NE | 41.88 -103.68 | 18-Jul | 18-Jul | 0 |
| York, NE | 87 -97.63 | 10-Jul | 10-Jul | 0 |
Source : unl.edu