By Scott Irwin
Department of Agricultural and Consumer Economics
University of Illinois
The March 31st Prospective Plantings report from the USDA continues to reverberate through the grain markets. The report indicated that both corn and soybean planted acreage was much smaller than expected (farmdoc daily, April 7, 2021). This has prompted considerable discussion about the possibility of USDA corn and soybean planted acreage estimates increasing in future reports, especially in the upcoming June Acreage report. An important constraint on any increase in corn and soybean acreage is the total size of crop acreage in the U.S. The purpose of this article is to update our earlier estimates of total crop acreage for the U.S. and explore the implications for the possibility of upward revisions in corn and soybean planted acreage this year.
Analysis
We have outlined the process of estimating total U.S. crop land acreage in several previous farmdoc daily articles (April 4, 2014; April 9, 2014; April 2, 2015; January 21, 2016). It is no simple matter to account for total crop acreage because of movement in and out of government acreage programs and the fact that available data is from different USDA agencies. We start our estimates in 1998 as this avoids accounting for annual set-aside acreage in earlier years and allows full adjustment to the planting flexibility that was first allowed in the 1996 “Freedom to Farm” bill.
The first component in the accounting of total crop acreage is principal crop acreage. As identified by the USDA in the most recent Prospective Plantings report:
Note that in our previous work on total crop acreage (e.g., farmdoc daily, January 21, 2016), we estimated double-cropped acreage and reported that separately from non-double cropped acreage. We do not do that here in order to simplify the analysis. Hence, double-cropped acreage is included in the principal crop acreage totals reported below. Finally, principal crop estimates used here are the latest available for each year as found in the USDA Quick Stats database.
Principal crop acreage for 1998 through 2020 is represented by the green bars in Figure 1. For this period, the principal crop total varied by 26.9 million acres, ranging from 303.3 to 330.0 million acres. The total is clearly correlated with crop prices, as there is a decline into the mid-2000s, an increase into the ethanol-led boom years, a decline and recovery into 2014, and then a decline again. The decline in the principal crop acreage from 2014 to 2020 is particularly notable, with at total drop of 16.6 million acres.
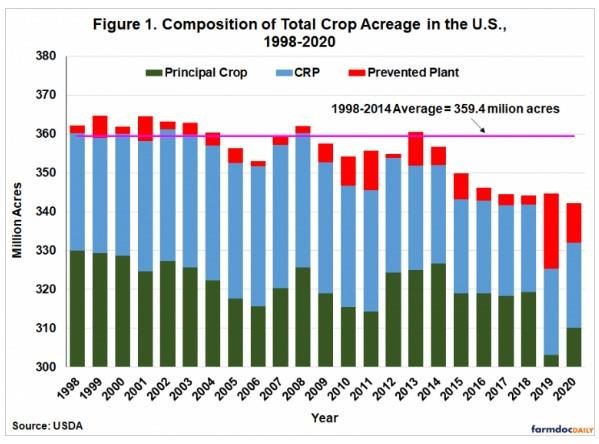
The second component of the accounting of total crop acreage is acreage enrolled in the Conservation Reserve Program (CRP). A January 2021 fact sheet from the USDA indicates that:
The eligibility criteria make it clear that in order to be enrolled in the CRP that agricultural land must have been used for crop production for a sustained period in the recent past. The total acreage enrolled in the CRP over 1998 through 2020 is represented by the blue bars in Figure 1. These annual totals reflect acreage enrolled as of November 1 in the previous calendar year (as reported by the USDA’s Farm Service Agency (FSA). Enrollment has steadily declined from a peak of 36.8 million acres in 2007 to a low of 21.9 million acres in 2020.
The third component of the accounting of total crop acreage is prevented plant acres. Federal crop insurance programs include a feature in most policies that triggers payments when extreme weather conditions prevent the planting of insured crops. The formal definition of prevented planting provided by the Risk Management Agency (RMA) of the USDA is as follows:
The prevented plant acreage data used here is collected from the RMA’s Cause of Loss Historical Data Files. Note that RMA prevent plant acreage data may differ slightly from the more widely-used Farm Service Agency data on prevented plant acreage. The RMA data is the primary source since it tracks actual payments on prevented plant acreage. The total prevent plant acreage over 1998 through 2020 is represented by the red bars in Figure 1. Naturally, the size of prevented plant acreage varies considerably across time depending on spring weather conditions. In most years, prevented plant acreage across all crops is less than five million acres. However, in years with extremely wet planting conditions, the total can exceed 10 million acres. The peak of 19.3 million acres occurred in 2019.
The net result of adding principal crop acres, CRP acres, and prevented plant acres is an estimate of total crop land acres for the U.S. This is represented by the top of the bars found in Figure 1. The total was relatively stable over 1998-2014, varying by roughly +/- 5 million acres from the average of 359.4 million. It is especially interesting to observe that total crop acreage was essentially fixed during the ethanol boom years of 2007-2013. This makes the decline in total crop acreage after 2014 all the more interesting. Total acreage declined from 356.7 million in 2014 to a low of 342.2 million in 2020, a decline of 14.4 million acres. It appears that total crop acreage is much more sensitive to crop price declines that crop price increases, at least in the U.S.
As indicated in our previous farmdoc daily articles on this topic, it is important to recognize that several non-price factors may contribute to the estimated variation of total crop acreage over time. One factor that may contribute to a small part of annual variation in principal crop acreage is that acreage of principal crops includes double counting of acreage of a failed crop that is replanted to a different crop. There may be small variations in that total from year-to-year.
A second factor that may contribute to annual variation is some “noise” in non-principal crop acreage. The CRP acreage used here, for example, is the acreage enrolled in the program as of November 1 in the year prior to spring planting. Actual CRP enrollment may have differed slightly from those estimates in some years. In addition, the proportion of the acreage that came out of the CRP, but was not cropped in the following year may have varied from year-to-year. Additionally, planted acreage of non-principal crops is not included in the estimates shown in Figure 1. Acreage of those crops varies some from year-to-year, which could account for a small part of the differences in total acreage from year-to-year.
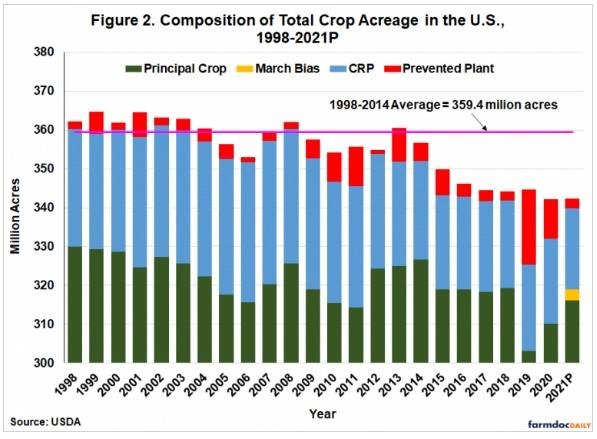
The final step of the analysis is to project total crop acreage for 2021 based on information available at the present time. This is shown in Figure 2. Principal crop acreage of 316.2 million acres is drawn directly from the March 2021 Prospective Plantings report. CRP acreage as of November 1, 2020 was 20.8 million acres. Since planting progress has been relatively rapid in 2021, prevented plant acreage for all crops is estimated as the average for years over 1998-2020 when prevented plant acreage was five million acres or less. That average is 2.6 million acres. A March bias term is included to reflect the fact that principle crop acres in the March Prospective Plantings report are consistently biased downward, especially when prevented plant acreage is low. The bias was estimated in a previous farmdoc daily article (April 28, 2021) to be 2.8 million acres. The sum of these four components results in a projected total crop acreage for 2021 of 342.4 million acres, only 0.2 million acres more than the total for 2020.
Implications
An important and often under-appreciated factor when anticipating acreage of crops planted each year is the total acreage base, or the size of the “acreage pie.” This is especially important this year given the surprisingly low estimates of corn and soybean planted acreage in the March Prospective Plantings report. There has been much speculation about the possibility of USDA corn and soybean planted acreage estimates increasing in the upcoming June Acreage report. Estimates of planted acreage for corn in the trade have been reportedly as large as 97 million acres, almost 6 million more than the March USDA estimate. Whether increases of this magnitude actually occur will likely depend on corresponding increases in the estimated total size of crop acreage. We account for a downward bias in March principal crop acreage estimates when projecting total crop acreage in 2021, but our estimate is still only slightly larger than last year. It appears that any large increases in corn and soybean planted acreage will have to come mainly at the expense of other principal crops.
Source : illinois.edu