By Scott Irwin
Department of Agricultural and Consumer Economics
University of Illinois
The U.S. ethanol industry entered 2020 in a slump. The industry experienced a losing year in 2019 for the first time in seven years and the average ethanol plant lost over $2 million (farmdoc daily,
January 29, 2020). The early months of 2020 were more of the same and then the COVID pandemic hit with full force in March. This resulted in the most severe contraction in the U.S. economy since the Great Depression and gasoline use cratered, pulling down ethanol along with it. At the worst point last spring, almost 50 percent of ethanol production in the U.S. was shuttered. It was hard to imagine a worse scenario for the ethanol industry. Then something happened. Gasoline demand started to recover and ethanol by-product prices strengthened sharply, which allowed operating ethanol plants to return to profitability in late spring (farmdoc daily,
August 13, 2020). The purpose of this article is to estimate the profitability of U.S. ethanol production for the entire 2020 calendar year and assess the continuing fallout from the COVID pandemic.
Ethanol Plant Model
A model of a representative Iowa ethanol plant is used to track the profitability of ethanol production. It is the same basic model of a representative ethanol plant that has been used in earlier farmdoc daily articles on the subject (e.g.,
March 14, 2018;
February 13, 2019;
January 29, 2020). The
original version of the model was developed by Don Hofstrand of Iowa State University and was meant to be representative of a typical ethanol plant constructed in the mid-2000s. There is certainly substantial variation in capacity and production efficiency across the industry and this should be kept in mind when viewing profit estimates based on the model.
Some of the original assumptions of the model have been changed based on additional analysis or changing data availability. Current model assumptions include:
- Dry mill plant constructed in 2007
- 100 million gallon annual ethanol production capacity
- Plant construction costs of $2.11 per gallon of ethanol production capacity
- 40% debt and 60% equity financing
- 8.25% interest on 10-year loan for debt financing, with the loan fully repaid in 2017
- A total of $0.21 fixed costs per gallon of ethanol produced through 2017 and $0.15 per gallon in 2018-2020 (the decline is due to the loan payoff)
- Non-corn, non-natural gas variable costs (including denaturant) of $0.21-$0.26 per gallon in 2007-2011
- Non-corn, non-natural gas variable costs excluding denaturant of $0.16 -$0.20 per gallon after 2011
- Variable denaturant costs after 2011 computed as 2 percent of wholesale CBOB price
- 30 cubic feet of natural gas per gallon of ethanol
- Netback (marketing) costs of $0.05 per gallon of ethanol and $4 per ton of DDGS
- Extraction and marketing costs of $0.05 per pound of corn oil
Operating efficiency assumptions represent a key component of the model. These have been revised substantially over time as new data has become available. The latest assumptions are based on analysis of the operating efficiency of the U.S. ethanol industry in a recent farmdoc daily article (
January 20, 2021). Specifically, the current assumptions for conversion rates are as follows:
- 2.75 gallons of ethanol (including denaturant) produced per bushel of corn processed over 2007-2011; 2.80 gallons of ethanol per bushel of corn over 2012-2014; 2.85 gallons of ethanol per bushel of corn over 2015-2018; and 2.90 gallons of ethanol per bushel of corn over 2019-2020
- 17.75 pounds of DDGS produced per bushel of corn processed over 2007-2011; 17.00 pounds of DDGS per bushel of corn for 2012-2016; 16.50 pounds of DDGS per bushel of corn over 2017-2018; 16.00 pounds of DDGS per bushel of corn in 2019; and 15.75 pounds of DDGS per bushel in 2020
- 0.55 pounds of corn oil per bushel of corn processed over 2012-2014 (start extracting January 2012); 0.60 pounds of corn oil per bushel of corn processed in 2015; 0.70 pounds of corn oil per bushel of corn processed in 2016; 0.75 pounds of corn oil per bushel of corn processed in 2017-2019; and 0.80 pounds of corn oil per bushel of corn processed in 2020
To track plant profitability over time, weekly corn, ethanol, and DDGS prices at
Iowa ethanol plants are collected starting in late January 2007. Crude corn oil prices for the Midwest are available from OPIS. Natural gas costs over 2007 through March 2014 are based on monthly industrial prices for Iowa available from the EIA. Due to a change in the behavior of the industrial price series, starting in April 2014 natural gas costs are based on monthly electric power consumer prices for Iowa, also from the EIA.
Analysis
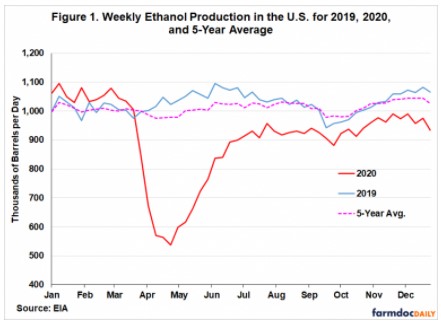
Before discussing estimates of the profitability of ethanol production in 2020, it is useful to review the impact of the COVID pandemic on ethanol production in the U.S. Figure 1 shows weekly ethanol production in the U.S. for 2019, 2020 and the five-year average. The impact of the COVID lockdowns is seen in a “swoosh” pattern of sharp decline, quick recovery, and then a longer period of very slow recovery. Notice that ethanol production dropped 48 percent between March 13th and April 24th, recovered sharply into June, and then leveled out roughly 10 percent below year ago levels for the remainder of 2020. It is important to recognize that the profit estimates discussed below assume that a plant operated throughout the year, which is obviously not true for a significant part of the industry.
Figures 2, 3, and 4 present a long-term perspective on revenue, costs, and profits per gallon, respectively, on a weekly basis from January 26, 2007 through January 22, 2021. Revenue (Figure 2) shows that all three components—ethanol, DDGS, and corn oil—were hit hard during the spring 2020 lockdowns. But outside of this fairly brief period, revenue during 2020 largely moved in the same range as it did over 2014-2019. Costs (Figure 3) showed a similar pattern, but shot very high towards the end of the year, driven by surging corn prices. In fact, total costs in December 2020 were the highest since late 2013. Without knowledge of the pandemic, the range of ethanol production profits net of all variable and fixed costs (Figure 4) in 2020 seems rather unremarkable and quite similar to the range of profits the previous six years. Weekly profits spent about as much time above the long-run average of $0.10 per gallon as below the average.
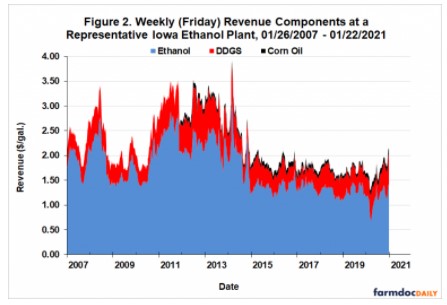
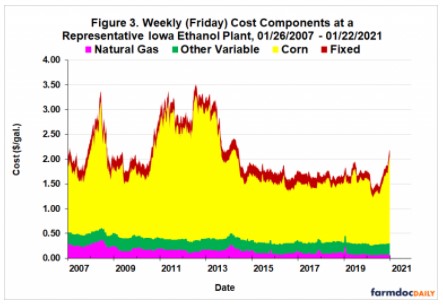
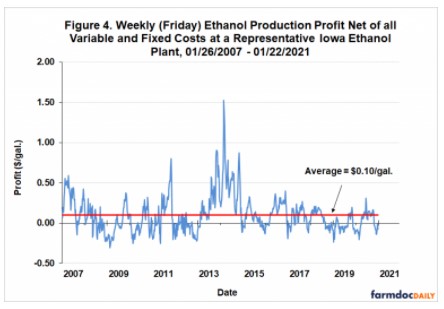
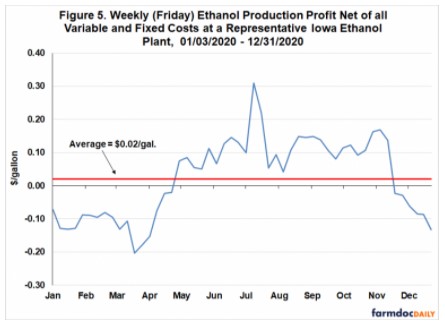
Figure 5 shows the same weekly net profits as in Figure 4, but with the data limited to 2020. This provides a close-in view of the development of ethanol plant profitability during 2020. From January through mid-March, net losses averaged about $0.10 per gallon and then dropped to losses of $0.15 to $0.20 during the spring lockdowns. It is important to acknowledge that the operating losses during the lockdown would have been catastrophically larger if nearly half of ethanol production had not been shuttered during this period. Profits for an operating plant recovered to positive territory in early May and remained there until the last week in November. Losses at the end of 2020 were basically at the same level as at the start of the year. Finally, the average profit for all of 2020 was $0.02 per gallon.
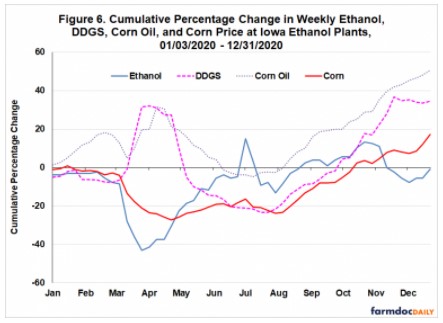
An obvious question is how operating ethanol plants were able to return to profitability so quickly after the spring 2020 lockdown. The answer is found in Figure 6, which shows the cumulative percentage change in the price of weekly ethanol, DDGS, corn oil, and corn at Iowa ethanol plants during 2020. This means that the each observation is the total price change since the first week in January 2020. Notice that the initial sharp drop in ethanol prices after the lockdowns was partially offset by dramatic increases in the price of DDGS and corn oil, by-products of ethanol production. The demand for by-products turned out to be more resilient during the pandemic lockdowns than the demand for ethanol. This actually makes sense because total by-product demand is heavily influenced by livestock numbers, which cannot not be adjusted very quickly. Corn oil prices continued to rise through July, while DDGS prices declined back to pre-COVID levels by early May. Then in May ethanol prices began to recover faster than corn prices, the main input cost for producing ethanol (around 80 percent of total cost), even exceeding pre-lockdown prices briefly during July. The net effect of these output and input price movements was to restore profitability for operating ethanol plants quicker than most expected. The operating profits continued in the black until late November, when the rally in corn prices finally outpaced the recovery in ethanol prices, pushing profits back into the red.
It is also useful to consider ethanol production profitability aggregated over an annual horizon for 2007-2020, as shown in Figure 7. Profits are presented in terms of both total pre-tax net returns and percent return to equity. The net profit of $2.2 million in 2020 almost exactly offset the 2019 annual loss of $2.3 million. It was the seventh profitable year in the last eight. With the 2020 profit, the total cumulative (pre-tax) return to equity holders for the 2007-2020 period stands at $146.7 million, $20 million more than the assumed equity investment for the representative plant of $126.6 million. We can use the average net loss for the representative plant to make a rough estimate of profit for the operating segment of the U.S. ethanol industry in 2020. Assuming all operating plants in the industry earned a net profit of $0.02 per gallon and that total ethanol production for the U.S. was 13.9 billion gallons in 2020, total (pre-tax) profit for operating ethanol plants can be estimated at $303 million.
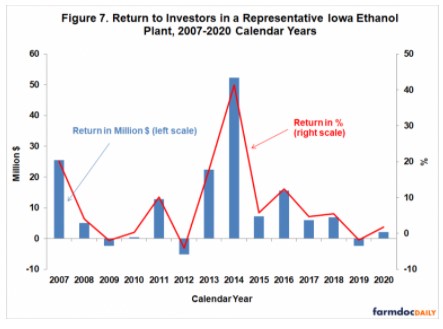
The percent return to equity holders provides useful information on the attractiveness of investment in ethanol plants relative to other investments. The average return was 8.3 percent over 2007-2020 and the standard deviation, a measure of risk, was 11.9 percent. By comparison, the average return for the stock market over this period, as
measured by the S&P 500, was 10.9 percent and the associated standard deviation was 17.5 percent. The ratio of average return to standard deviation provides one measuring stick of an investment’s return-risk attractiveness, and on this measure the ratio for ethanol investment, 0.69, is on par with the ratio for the stock market as a whole, 0.62. This provides important context when considering the tumultuous year experienced by ethanol producers in 2020. Even with this crazy year included in the data, ethanol plants have a respectable record of investment performance over the last 14 years.
Implications
2020 was indeed a year unlike any other for the U.S. ethanol industry. Despite the unprecedented consequences of the COVID pandemic, operating ethanol plants managed an average profit of $0.02 per gallon for 2020. This feat was accomplished because of the strength in ethanol by-product prices—DDGS and corn oil—for much of the year and the fact that ethanol prices recovered faster than corn prices following the spring pandemic lockdowns. It is interesting to note that estimated profit in 2020 for an operating ethanol plant almost exactly offset the loss from 2019. All of these results assume that an ethanol plant was in operation throughout 2020, which was obviously not the case for a substantial part of the industry. At a minimum, around 10 percent of ethanol production was shuttered for almost three-quarters of the year. A complete financial picture of the ethanol industry in 2020 should take into account the cost of shuttering ethanol plants and reopening them. It is difficult to estimate these additional costs with much precision, but our previous analysis (farmdoc daily,
August 13, 2020) suggests it is in the hundreds of millions of dollars for the U.S. ethanol industry as a whole.
Source : illinois.edu