By Jonathan Coppess
The calendar continues to countdown towards the scheduled expiration of the 2018 Farm Bill, but there have been no public indications that either the House or Senate Agriculture Committees have resolved the critical commodity policy disputes for reauthorization. This article provides yet another perspective on the reference price and base acre discussion, using a sample farm thought experiment to dissect policy design differences and issues. Much of the background having been discussed in previous articles, this article proceeds directly to the discussion (see e.g., farmdoc daily, June 29, 2023; July 20, 2023; August 3, 2023; August 10, 2023).
Three Years in the Life of a Sample Farm; Another Thought Experiment
Much of the focus in a Congressional authorization debate will be centered on a national level and with Congressional Budget Office (CBO) projections. One of the challenges of the baseline system used in Congress is the baseline-within-the-baseline; in other words, CBO projects spending by program crop or covered commodity, but this is not the reality for farmers. Farmers rarely produce only a single crop and farms are unlikely to have only one category or type of base acre. Instead, farming often operates on multiple crops and in a rotation. To that reality, this discussion begins by creating a sample farm for each state that allows for another thought experiment in the Price Loss Coverage (PLC) policy design.
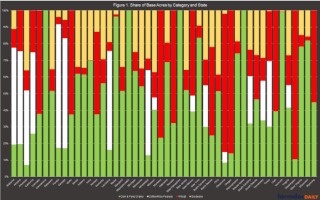
For this discussion, each state is represented by a sample farm that consists of 1,000 total base acres. In some states, this would be a large farm; in other states, it would not. It is not, however, an unreasonable or unrealistic farm size and it permits comparisons across states. The total base acres for the sample farm are divided proportionately according to the share each of base acres for each of the major program crops (corn, soybeans, wheat, seed cotton, sorghum, barley, oats, rice (long grain, medium/short grain, and temporate japonica), and peanuts) in the state. The base acres used are those for 2019 that were enrolled in ARC and PLC as reported by USDA’s Farm Service Agency (USDA-FSA, ARC/PLC Program Data). Figure 1 presents each state’s share of base acres by category of major program crops (corn and other feed grains, cotton-rice-peanuts, wheat, and soybeans) in 2019.
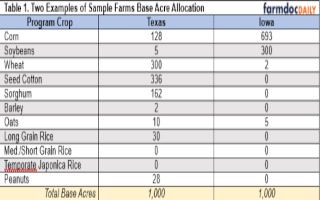
The 1,000 base acres are apportioned based on each program crop’s share. To further demonstrate the sample farm design, Table 1 compares the sample farm in Texas with the one in Iowa.
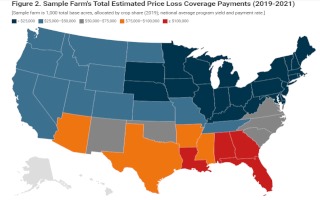
Finally, all base acres are assumed to be enrolled in PLC for the 2019, 2020 and 2021 crop years. For each year, the payment rate and national average yield reported by USDA’s Farm Service Agency are used to calculate an amount per base acre, which is multiplied by 85% for the payment acres (USDA-FSA, ARC/PLC Program Data; farmdoc daily, August 10, 2023). Figure 2 presents an interactive map for the sample farm in each state, presenting the estimated total PLC payments for 2019-2021, as well as the total for each of the major program crops.
Supporting the map, Figure 3 illustrates the national average payment amounts (payment rate (difference between MYA and effective reference price) times average program yield) on top of the average gross value of production as reported by USDA’s Economic Research Service for the 2019 program and crop year (USDA-ERS, Commodity Costs and Returns). The amounts in Figure 3 help further explain the calculations in the map, as well as provide a comparison between the payment amounts and what farmers would have received for the crop, on average. For example, the peanut payment amount exceeds 25% of the gross value of production, while corn is less than 3%.
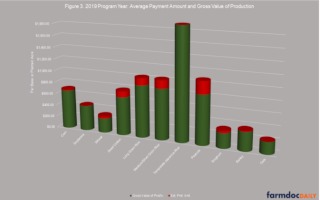
Figure 4 presents the total payments for all three years by state and program crop that are presented in the map in Figure 2 using the payment amounts in Figure 3 on 85% of the allocated base acres. To help highlight the differences, a light blue area is included at $25,000 in total estimated PLC Payments for the three years. Note that twenty-two States using this sample farm method would not have exceeded $25,000 in total payments on 1,000 base acres in 2019 to 2021, and thirteen additional States would have received between $25,000 and $50,000.
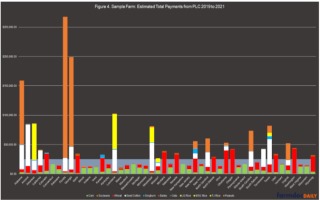
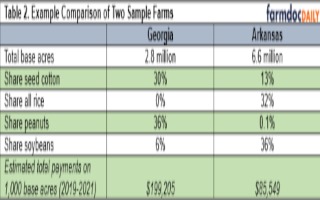
Disparities among sample farms within the South are also notable. Florida, Georgia, and Alabama have high estimated payment levels compared to Arkansas and Mississippi, as well as Texas. The difference being peanut base acres. Arkansas and Mississippi have almost no peanut base (less than 1%) and Texas has roughly 3% peanut base. Arkansas and Mississippi also have significant base acreage in soybeans (36% and 29%, respectively), which received no payments. Table 2 provides a comparison between the Georgia and Arkansas sample farms to help demonstrate further the differences.
The sample farm method permits comparisons that have some alignment with reality. Farms of the same program size (1,000 total base acres) experience very different program outcomes depending on the allocation of base acres among the major program crops. The answer to that difference is again found in the policy design for PLC and the political decisions in Congress for establishing statutory reference prices.
Yet Another Look at Statutory Reference Prices
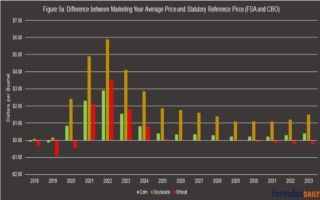
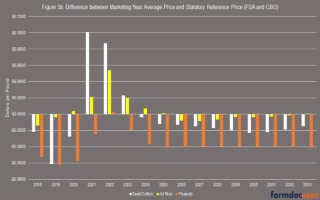
Figures 5a and 5b present the difference between the marketing year average (MYA) price and the statutory reference price for six of the major program crops. Figure 5a presents the bushel crops (corn, soybeans, and wheat), while Figure 5b the pound crops (seed cotton, all rice, and peanuts) (note that all rice has been converted to pounds from hundredweight).
The disparities in program outcomes for the sample farms are the result of the differences in statutory reference prices. What complicates this matter in a Congressional farm bill debate is the impact of the CBO baseline and ten-year scoring projections. This returns the discussion back to the national level scale. Table 2 provides a comparison of the six major program crops (corn, soybeans, wheat, seed cotton, all rice, and peanuts) for the 2019 program year. Note that actual 2019 MYA prices are reported in the February 2021 Baseline (CBO, February 2021) and the resulting outlays would be in fiscal year 2021 reported in the May 2022 Baseline (CBO, May 2022).
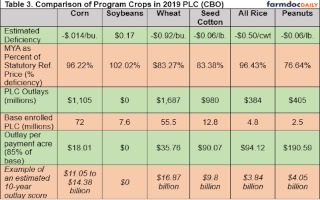
Compare corn and all rice; with similar percentage deficiencies in 2019 (96.22% to 96.43%, respectively) the difference in base acres (72 million to 4.8 million) resulted in outlays that were three times as large ($1.1 billion to $384 million). If the outlays in FY2021 for the 2019 PLC deficiencies were scored over 10 years, then the total cost in corn payments would exceed $11 billion while for all rice the total would be less than $4 billion; an actual score would differ from this for corn, however, because CBO would be likely to assume that most or all base acres enrolled in PLC driving up the costs considerably. A similar comparison exists for wheat and seed cotton, both with similar deficiencies (83.27% for wheat and 83.38% for seed cotton) but wheat outlays were almost twice as much due to significantly more base acres (55.5 million to 13 million, respectively). Here again, a ten-year CBO score would be nearly twice as large for wheat as for seed cotton on similar deficiencies.
Concluding Thoughts
The thought experiment discussed in this article is, in part, a reminder that on the other end of all public policies are people. Using a sample farm for each state that is of equal size in the program (1,000 total base acres) is an attempt to compare the differential impacts of political decisions in policy design; it is the rare farmer who produces only a single crop, the rare farm with only one type of base acre. When viewed through a state-level sample farm, the policy design inequities are clear and straightforward. High statutory reference prices for peanut and rice base acres result in large payments for farmers and farms with base acres in those crops. Not all base acres were created equal. Only the smallest factional interests reap the most benefits. This reality raises many difficult questions about farm policy and politics; whether Congress perpetuates, reduces, or magnifies the imbalances is among the pressing questions for a 2023 Farm Bill.
Source : illinois.edu