The payment frequency on the Supplemental Coverage (SCO) and Enhanced Coverage Options (ECO) has been lower than expected from 2015 to 2022. Herein, we provide a historical analysis of SCO and ECO at the 95% level for Illinois counties on corn and soybeans. Given these low payment frequencies, electing SCO and ECO in future crops years is questionable. Further analysis will be provided closer to the March 15th deadline for making crop insurance decisions in Illinois.
Background
SCO and ECO are add-on products to an underlying plan of Revenue Protection (RP), RP with the harvest price exclusion (RPhpe), or Yield Protection (YP). RP, RPhpe, and YP provide insurance based on farm yields. SCO and ECO provide county coverage above the coverage level of the underlying product. SCO provides coverage from 86% down to the coverage level of the underlying product. ECO protects from either 90% or 95% down to 86%. With a combination of ECO and SCO, an individual can receive coverage from either 95% or 90% to the coverage of the underlying product (see farmdoc daily, February 27, 2014, April 24, 2012, November 24, 2020).
SCO and ECO offer county coverage, which differs from the farm coverage of the underlying product. County products can trigger payments when farm-level products do not, and vice versa. Using SCO and ECO introduces the possibility that a farm will have a loss, and the county does not, and vice versa (see farmdoc daily May 5, 2021, and May 6, 2021, for these risks).
SCO was used on 5.0% of eligible acres in 2021 and 5.4% in 2022. ECO use averaged 3.1% of eligible acres in 2021 and 3.4% in 2022 (see farmdoc daily, August 9, 2022). Illinois had higher use compared with the national average and other Midwest states.
Historical Payments on SCO and ECO
We calculate the number of years SCO and ECO triggered from 2015 to 2022, a total of eight years. SCO has existed for all these years. ECO has only existed since 2021, but we calculated trigger years as if it existed for all years from 2015 onward. We calculated trigger years for corn and soybeans, with RP as the underlying product. RP was selected because it is used on over 93% of the insured acres of both corn and soybeans (see farmdoc daily, November 17, 2020).
Figure 1 shows four maps: Two on the left for corn and two on the right for soybeans. Two maps show the number of years SCO triggers for each crop. The other maps show trigger years for ECO-95%. Note that ECO-90% will trigger payments in more years than SCO, but fewer years than ECO-95%.
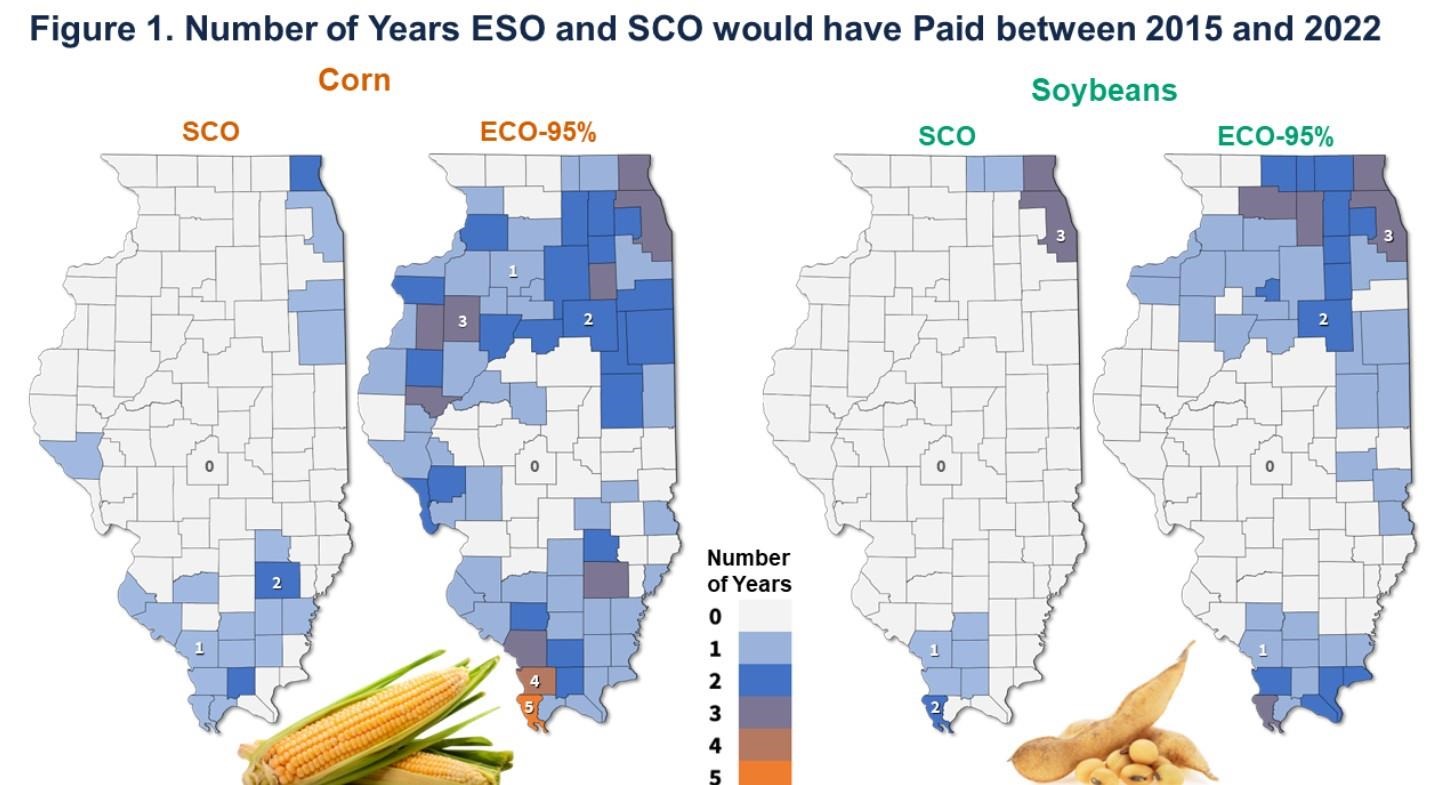
SCO has not triggered payments in most northern and central Illinois counties for either corn or soybeans (see Figure 1). Of the 102 counties in Illinois, SCO did not trigger in 82 counties (80%) for corn and 92 counties (90%) for soybeans. Most counties that had SCO payments were in either northeast Illinois or southern Illinois, except for one SCO payment for corn in Pike County in west-central Illinois.
ECO-95% triggered in more counties, but 29% of counties did not trigger for corn and 55% for soybeans. For corn, counties that did not trigger were mostly in central Illinois, moving into southern Illinois. There were four counties along the Wisconsin border. For soybeans, many counties in central and southern Illinois did not trigger ECO-95% level payments, along with three counties near Wisconsin (see Figure 1).
For those counties that received payments, most had payment in 3 or fewer years. The exception was two southern Illinois counties for corn: Alexander triggered, or would have triggered, payments in five years; Union County would have triggered payments in four years. Over the eight years considered, receiving payment in 3 years results in a 37.5% payment frequency.
Commentary
Over all the Illinois Counties and in all years from 2015 to 2022, the frequency of payments for corn was 2% for SCO and 14% for ECO-95%. For soybeans, the payment frequency was 2% for SCO and 8% for ECO-95%. These frequencies are much lower than expected. Based on a longer historical analysis, payments on SCO were expected at roughly 33% for corn and 20% for soybeans. ECO-95% payments were expected to trigger in 67% of years for corn and 53% for soybeans (farmdoc daily, December 10, 2020).
At these 2015-2022 payment frequencies, the advisability of taking either SCO or ECO is questionable from a farmer’s perspective. The advisability of taking SCO and ECO will depend on an assessment of whether the 2015 to 2022 period was an anomaly or whether the 2015-2022 frequency of payments should be expected moving into 2024 and beyond. Price changes from 2015 to 2022 are as expected: corn and soybean prices decreased in half the year. Yields have been relatively stable in the 2015-2022 period, with few yield shortfalls. For SCO and ECO use, the question is whether yield stability will continue.
Source : illinois.edu