By Julie Deering
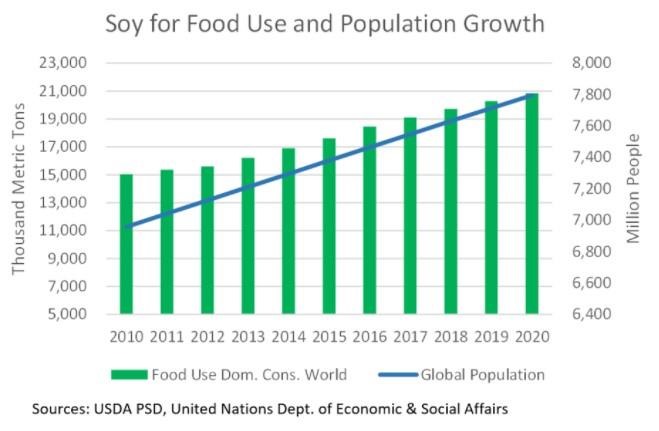
With a compound annual growth rate (CAGR) of 3%, demand for soyfoods continues to climb around the world with Asia, Western Europe and Latin America as the biggest markets, according to a new report by Agromeris. Meanwhile, global population grew at a CAGR of 1% during this same period (2010-2020), and per capita soy for food use grew from 2.16 kilograms per person in 2010 to 2.67 kilograms in 2020.
“The report is designed to examine the relationships between soy foods product sales and soybean trade, production and consumption on both gross and per capita levels for 2016 through 2020,” says Will McNair, U.S. Soybean Export Council director of Oil and Human Protein. “The information included provides an excellent market overview and may help exporters and consumer-packed goods companies determine where it makes sense to invest.”
In 2020, global sales of soyfoods reached $16.1 billion. McNair points out that crush drives production, and Asia drives food use.
Defined as the processing of soybeans into meal and oil, crush jumped 100 million metric tons (MMT) from 2010 to 2020 to 322.4 MMT. Globally domestic food use grew from 15.05 MMT to 20.85 MMT during the same period, of which 96% was consumed in Asia.
Despite being the largest, most mature soyfoods market, with by far the highest regional per capita consumption of soybeans for food, Asia remains the geographic nexus for meaningful growth in soyfoods. If Asia’s 2.9% CAGR continues, incremental sales in 2021 would be approximately $467 million.
In comparison, if West Europe (the second largest regional soyfoods market by sales) were to continue its 1.51% annual growth rate, the year-to-year sales increase in 2021 would be about $31 million. The next largest regional market (excluding North America) is Latin America, comprising 4.67% of the global soyfoods market. With sales of $751 million in 2020, soyfood sales have a negative CAGR of 1.1%, driven primarily by Argentina and Brazil.
The report dives into detail for each of these regional markets and by product.
When looking at global soyfood products, soymilk takes the lead with 60.1% of total global soyfood sales.
Soymilk is both the largest and slowest growing product segment. Meanwhile, every product segment with a CAGR greater than 5% from 2016-2020 is classified as a “meat replacement.” Together these segments accounted for $1.12 billion in sales in 2020 and 7% of the global soyfoods market.
The differences in volume and value between newer and established soyfoods markets and product segments offer the greatest opportunities for increasing soybeans used for food in export markets is the latter.
Click here to see more...