By Gary Schnitkey and Jim Baltz et.al
Department of Agricultural and Consumer Economics
University of Illinois
Carl Zulauf
Department of Agricultural, Environmental and Development Economics
Ohio State University
Inflation rates have reached relatively high levels recently, raising questions about inflation’s impacts on corn and soybean prices. Overall, there is a weak positive correlation between inflation and commodity prices. We present a history of inflation rates based on year-over-year percent change in consumer price index, corn and soybean prices, and then discuss linkages between inflation rates and commodity prices.
Inflation
Inflation has increased in recent months (see Figure 1). As measured by the Consumer Price Index (CPI) for urban consumers, the inflation rate was above 8.0% in the last three months: 8.6% in March, 8.2% in April, and 8.5% in May.
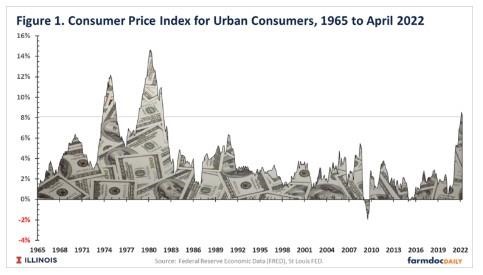
Before 2022, the last time the inflation rate exceeded 8.0% was in January 1982, near the end of a high-inflationary period stretching from 1973 through 1981 (see Figure 1). During this period, inflation rates were above 8.0% every month from October 1973 through August 1975 and again from September 1978 through January 1982 (see Figure 1). The impacts of high inflation on the economy were worrisome, ultimately leading to the appointment of Paul Volcker as chair of the Federal Reserve Bank (FED) in August 1979. While Volcker was the chair, the FED undertook actions to lower the inflation rates (see Federal Reserve History). As a result, inflation declined, and the United States enjoyed relatively low inflation from 1983 through 2020, when the inflation rate averaged 2.6%.
Inflation increased during the last half of 2021, with inflation rates exceeding 6.0% every month since October 2021. Various explanations can be given for these higher levels:
- COVID and responses led to a recessionary period in which consumer spending slowed and savings increased, bringing about increased spending from pent-up demand as economic activity resumed.
- The pandemic caused supply chain disruptions. Now, global markets are attempting to adjust to consumer demand for products and services that have changed from pre-COVID levels. Adjustments are leading to shortages, overall difficulties in meeting consumer demand, and higher prices.
- The Federal government instituted aid packages placing a great deal of money into the economy and directly to consumers, thereby increasing spending power and demand for products, likely leading to price increases.
- Energy prices have increased, because of both governmental policies and the Ukraine-Russia war.
- Food prices have increased because of strong global demand.
- Higher labor costs as employers raise wages to attract workers. Labor wage inflation that often translates into higher general inflation (see farmdoc daily January 6, 2022)
Corn and Soybean Prices
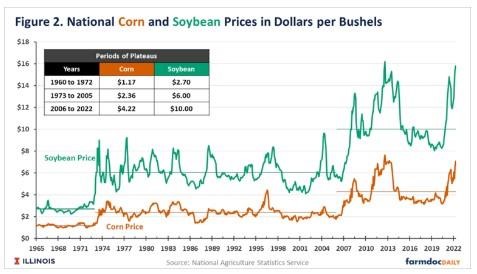
Over time, corn and soybean prices do not share the same patterns as inflation rates. Corn and soybeans have exhibited long periods of nominal prices varying around a plateau or “long-run” average price (see farmdoc daily, May 31, 2022, March 29, 2011, and February 28, 2013). During these periods, prices exhibit significant variations around the long-run average but do not trend up or down (see Figure 2). Periods of plateaus are:
- 1960 to 1972. From 1960 to 1972, corn prices averaged $1.17, and soybean prices averaged $2.70 per bushel.
- 1973 to 2005. From 1973 to 2005, corn prices averaged $2.36 per bushel, and soybean prices averaged $6.00 per bushel.
- After 2006. From 2006 to 2022, corn prices have averaged $4.22 per bushel, and soybean prices have averaged $10.00 per bushel.
Generally, some identifiable factors cause a change in long-run prices. For example, increased export demand and an overall increase in global trade are attributed to the rise in 1973. The use of corn in ethanol production and growth in major export markets such as China led to an increase in 2006.
Further note that corn and soybean prices are highly correlated. From 1963 to the present, the correlation coefficient between corn and soybean prices was .94. A major use of corn and soybeans is livestock feed, meaning that the same demand factors influence each crop. Moreover, the crops are produced in the same production regions, resulting in yields being positively correlated. Acreages used in corn and soybeans production in the U.S. are relatively fixed, and slow to adjust. Since both prices are highly correlated, the following section focuses on corn prices, but the same factors describe also apply to soybeans.
Inflation and Changes in Long-Run Prices
The change in long-run prices occurring in 1973 coincided with the beginning of a period of higher inflation (see Figure 3). Corn prices exceeded $2.00 per bushel for the first time in July 1973. In April 1973, inflation rates exceeded 5.0%.
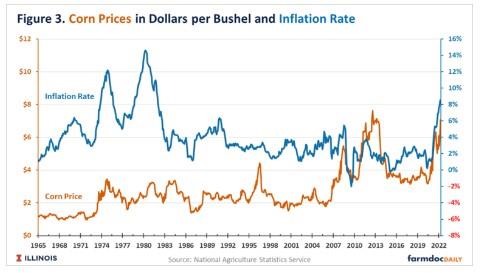
The change in long-run price in 2006 was not associated with a period of higher inflation. Inflation rates varied during the 2000s but did not reach levels experienced during the 1970s and early 1980s.
As a result, historical changes do not present a clear linkage between inflation and long-run price changes. While prices increased to a new higher plateau during roughly the same period of higher inflation in 1973, the higher prices likely had to do more with export demand than with inflation. If anything, the increase in commodity prices reinforced higher inflation.
Currently, corn prices are well above the $4.22 average representing the plateau since 2006 (see Figure 3). Inflation also is at relatively high levels. As a result, it could be posited that commodity prices have reached a new plateau similar to 1973.
There are reasons to be cautious of this view. First, linkages between long-run commodity price changes and inflation are tenuous. Second, we have seen prices at current levels in 2011 and 2012, after which prices fell well below the $4.22 long-run average. Third, previous changes in long-run prices are linked to long-run supply-demand changes: Export demand increased in 1973 and corn use in producing ethanol occurred in the mid-2000s. Currently, a factor causing a permanent or long-lasting supply-demand change has not been identified. Factors causing current higher prices are likely temporary, such as strong commodity demand from China that could be reduced with better Chinese crops or a Chinese recession, or an end to the Ukraine-Russia war in the future.
Even if a new long-run plateau occurs, it may not be at current price levels. Prices could average well below the current break-even levels of $4.73 per bushel for corn and $11.06 for soybeans (see farmdoc daily, December 21, 2021). Lower prices will likely occur in the future because of above-trend yields increasing supply.
Correlation between Inflation Rates and Prices
We calculated the monthly difference in the monthly price and the long-run prices, and then correlated that difference to the inflation rate. Correlation coefficients were .19 for corn and .11 for soybeans. A slightly positive relationship exists between inflation rates and corn and soybean prices.
As expected with the low correlation coefficients, the relationships between inflation and commodity prices are not strong. There have been periods in which inflation rates have been relatively high, and commodity prices were low, as occurred in 1999. Conversely, commodity prices reached all-time highs in 2011 and 2012, and inflation rates were relatively low.
Summary
Linkages between inflation and commodity prices are tenuous. Overall, market demand and supply factors significantly influence corn and soybean price levels more than inflation rates. Current high inflation rates do not necessarily signal a continuing period of high commodity prices.
Source : illinois.edu