By Christopher “Chip” Redmond
The Kansas Mesonet is launching a new tool: soil moisture monitoring. Soil moisture is important for many field decisions. The Mesonet Soil Moisture page provides a general overview of the conditions across the state and by each station. This article gives a description of how soil moisture is monitored and reported.
Figure 1. Screenshot of the menu path to the new Soil Moisture page on the Kansas Mesonet.
Soil Moisture
All Kansas Mesonet tower stations measure soil moisture at four depths. We utilize a time differential reflectometer probe (TDR) by Campbell Scientific, the CS655 model. Installation of current sensors began in mid-2017 and were completed early 2018. Data beyond 365 days is not currently available online but can be obtained by emailing the Mesonet (kansas-wdl@ksu.edu).
Soil Depths and Location
- Standardized depths consist of: 5, 10, 20, and 50 cm (approximately 2, 4, 8, and 20 inches).
- Locations of the sensors are also standardized at all stations with all soil sensors placed four feet south of the station.
Influencing Factors on Soil Moisture
Soil moisture is highly dependent on countless variables that can have local influences on the measured values, thus creating biases in the data. The Kansas Mesonet strives to limit these factors and make individual station data as representative of the surrounding region as possible.
- Soil type: Kansas has a diverse range of soil types, from sandy soils in the southwest to shallow soil over limestone in the Flint Hills. Often these types vary over very small distances and may not be representative of your location. Keep this in mind when using the data.
- Sandy soil: Grass is hard to maintain as a cover. Often, it is dug up by animals, blown away, or redeposited. This can allow water to penetrate easier into the soil or resurface a sensor making it respond faster than expected to atmospheric changes.
- Clay soil: Often the freeze/thaw process along with wetting/drying will cause uplift and/or sinking of the surface soil. As with erosion, this action can uplift or shift sensors deeper/shallower in the soil.
- The Mesonet staff verifies sensors aren’t disturbed during maintenance visits.
- Ground cover: Soil measurements are taken under sod at all stations. However, there are a few exceptions where grass struggles to grow and it may change between maintenance visits. Grass cover will create faster uptake of soil moisture during the growing season due to plant demand.
- Soil depth: The depth of the sensors will often determine the type of soil and responsiveness to precipitation. The deeper in the soil, the slower the response time. Therefore, 2-inch sensors will often respond immediately to rainfall. Moisture takes longer to penetrate deep into the soil and therefore, the 8- and 20-inch sensors will take the longest to increase after a rain event. They will also take the longest to dry out (Figure 2).
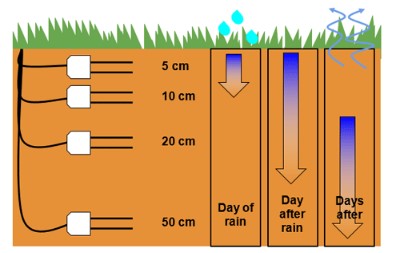
Figure 2. Soil moisture sensors at four soil depths (5, 10, 20, and 50 cm) and a general depiction of soil water movement following a rain event. Graphic from Kansas Mesonet.
Understanding the Webpage
There are some changes compared to other web pages on the Mesonet. The soil moisture measurements are displayed in two forms:
- VWC, volumetric water content. This can be calculated directly through the sensor and describes the amount of water contained within the area measured by the sensor. This value is unitless and considered to be cubic meter/cubic meter (m3/m3). The Mesonet uses a refined version of this calculation that incorporates other raw measurements from the sensor for a more accurate representation of soil moisture.
- % sat, percent of saturation. Using volumetric water content over time, upper and lower limits of the soil moisture are obtained during very wet and drought periods. These limits can define the wettest (100%) and driest (0%) percentage and provide historical context to current measurements.
“Wet vs Dry” verbiage is used at each station and depth to provide a quick and easy understanding of the current moisture present. Occasionally, “getting wetter” and “getting drier” will also follow the generic description. This description is the difference between the current measurement and that of seven days ago. It provides insight into general trends observed at each depth to assist in understanding the current state of the soil. Different from previous pages, you also have the ability to see these changes on a map with the “7-Day Change” for each depth using volumetric water content.
Lastly, the chart section has also been revised/improved to show larger scale trends beyond the initial seven days. The map is interactive as on previous pages. However, users now have the option to display the last 30, 90, and 365 days. This is a great tool to see numerous phenomena and trends during corresponding wet/dry periods. See below for some examples.
Using the Data
How might you benefit from Kansas Mesonet soil moisture data? Here are a few examples:
- Non-irrigated fields: A direct correlation to the demand and water availability during plant growth. Can assist in crop yield estimates.
- Irrigated fields: Though relationship may be different between water availability, the curves and trends can be very useful for determining the water demand. Mesonet measurements can also be used to calibrate and provide a standard reference to other soil module monitoring systems. With one comparable standard, sensors in specific applications can now be cross-analyzed from individual farm/fields making it more useful on a regional scale.
- Drought awareness: Though rainfall deficit can provide a quick proxy for drought, soil moisture is the best indicator for vegetative water demand. It can also provide an early warning for increasing demands of irrigation and other water use/storage trough curves and rapid declines.
- Runoff estimates: Heavy rainfall impacts are usually dictated by how saturated the surface is at the time of the event. Through curves on the chart, you can observe hourly rainfall and resulting influences by depth. During high rain rates, you can calculate the impact runoff may have due to resulting curves by depth. If there is a high rain rate, reactions may only be noted in the 2-inch sensor and thus significant runoff is/may be occurring.
- Statewide statistics: The table lets you quickly view and sort data from across the state. You can also download data to perform your own analysis (see the Download tab).
- Graphics and social media: Download any of the maps in .PNG format for easy sharing.
For more information on navigating this resource, users can select a page tour from the main soil moisture page located at the top of the featured map.