By Scott Irwin and Todd Hubbs
Department of Agricultural and Consumer Economics
University of Illinois
In a series of farmdoc daily articles in recent weeks (
April 17, 2019;
April 24, 2019;
May 1, 2019) we examined how fast the U.S. corn crop can be planted, the likelihood that the corn crop can be planted this year in a timely manner, and the implications of projected late planting for the U.S. average corn yield. Wet and/or cold conditions in much of the Corn Belt this spring have heightened interest in these questions. The USDA’s most recent weekly
Crop Progress report indicated that only 23 percent of the corn acreage in 18 major producing states was planted as of May 5, compared to a five-year average of 46 percent. These conditions suggests there is high likelihood that more than the average percentage of U.S. corn acreage will be planted late in 2019. In this article, we examine the implications of projected late planting in 2019 for the U.S. planted acreage of corn and soybeans. We also examine the implications for prevented planting of both crops.
Analysis
We begin by reviewing the estimates of late planting for corn used in recent farmdoc daily articles (
April 24, 2019;
May 1, 2019). Figure 1 shows the percentage of corn planted late in the U.S. over 1980-2018 based on a May 30 cutoff from 1980 through 1985 and a May 20 cutoff date from 1986-2018. The change in cutoff dates in the mid-1980s reflects recommendations for earlier planting that appeared around that time. On average, late planting based on this measure was 16.8 percent, with the bulk of the observations between about 5 and 25 percent. There is no evidence of a trend up or down over time in the late planting percentage, which suggests that producer behavior in aggregate with respect to late corn planting has been quite stable. The amount of late planting does vary substantially from year-to-year, ranging from a low of 2.9 percent in 1986 to a high of 46.9 percent in 1995. Note that years with especially high late planting were clustered in the mid-1990s (1993, 1995, and 1996) and the magnitude of late planting in these years ranged between about 20 and 30 percent above average.
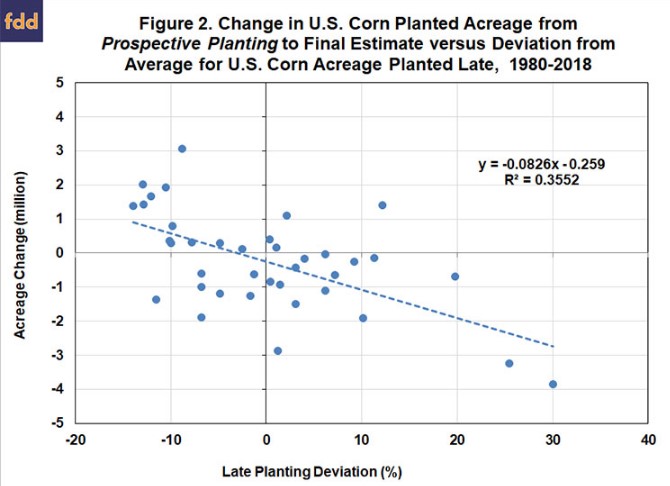
The first step of the analysis is to estimate the impact of late planting on the U.S. planted acreage of corn. We focus on the difference each year between the estimate of U.S. planted corn acreage released in the
Prospective Plantings report (typically on March 30th) and the final estimate released in the
Crop Production Annual Summary (usually in the following January) because the estimate in the Prospective Plantings report is a widely used benchmark at this time of year. Figure 2 shows the relationship between the change from the Prospective Plantings estimate to the final estimate and the deviation from average for U.S. corn acreage planted late over 1980 through 2018. As expected, there is an overall negative relationship between late planting and planted acreage changes. The relationship is linear, which contrasts with the highly non-linear relationship found previously for late planting and deviations from trend yield (farmdoc daily,
May 1, 2019). However, the explanatory power of the regression model in Figure 2, 35.5 percent, is much higher than what we found for trend yield deviations (12.2 percent). The estimated regression line indicates that when late planting is 10 percent above average the estimate of planted corn acreage is projected to drop by about 1 million acres. If late planting is 20 percent above average, planted corn acreage is projected to drop 2 million acres, and if late planting is 30 percent above average the drop is 3 million acres.
While the acreage model has a higher explanatory power than the yield model in relation to late planting, it is still not all that high, which suggests one should treat the estimated relationship with a good deal of caution. An alternative and potentially more robust approach is to directly compute probabilities and planted acreage changes for two different categories of late planting—not late and very late. Specifically, when planting is not late (negative to +9.9 percent): i) the chance of corn planted acreage increasing is 47 percent; ii) the chance of planted acreage decreasing is 53 percent; and iii) the average change is almost exactly zero. When planting is very late (10 percent or more): i) the chance of corn planted acreage increasing is only 17 percent; ii) the chance of planted acreage decreasing is 83 percent; and iii) the average change is -1.4 million acres. So, there is a notable impact of late planting when it is large. The six years with the largest level of late planting during the sample period were 2013, 2002, 2009, 1996, 1993, and 1995 (in that order).
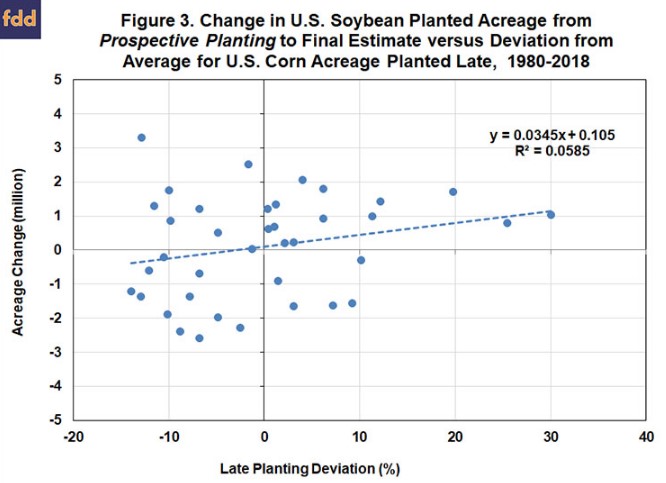
The second step of the analysis is to estimate the impact of late corn planting on the U.S. planted acreage of soybeans. The conventional wisdom is that changes in corn and soybean acreage during the planting season move in opposite directions due to competition between the two crops for the same acres. We again focus on the difference each year in the estimate of U.S. planted soybean acreage released in the Prospective Plantings report (typically released on March 30th) and the final estimate reported in the Crop Production Annual Summary (usually released in the following January). Figure 3 shows the relationship between the change in soybean planted acreage from the Prospective Plantings estimate to the final estimate and the deviation from average for U.S. corn acreage planted late over 1980 through 2018. As expected, there is an overall positive relationship between late corn planting and soybean planted acreage changes. The explanatory power of the regression model in Figure 3 is very low and much lower than what we found for planted corn acreage changes. Potentially more useful information is revealed by computing probabilities and soybean planted acreage changes for the two different categories of late corn planting—not late and very late. Specifically, when corn planting is not late (negative to +9.9 percent): i) the chance of soybean planted acreage increasing is 47 percent; ii) the chance of soybean planted acreage decreasing is 53 percent; and iii) the average change is -0.1 million acres. When corn planting is very late (10 percent or more): i) the chance of soybean planted acreage decreasing is only 17 percent; ii) the chance of planted acreage increasing is 83 percent; and iii) the average change is +0.9 million acres.
The third step of the analysis is to examine the impact of late corn planting on prevented planting of corn and soybeans. Prevented planting payments are available through individual (as opposed to area) crop insurance policies once a “final planting date” has been reached (farmdoc daily,
May 7, 2019). It is important to understand that the final planting date for prevented planting eligibility varies geographically across the Corn Belt and through time. In addition, the final corn prevented planting date generally is later than the date we use, May 20th, to define late planting. In most of the Corn Belt, the final planting date for corn prevented planting payments is between May 25th and June 5th (see Figure 1 in the farmdoc daily article of
May 7, 2019).
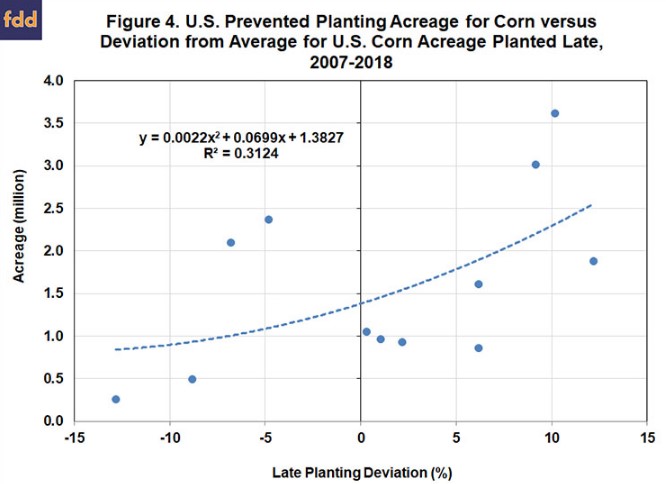
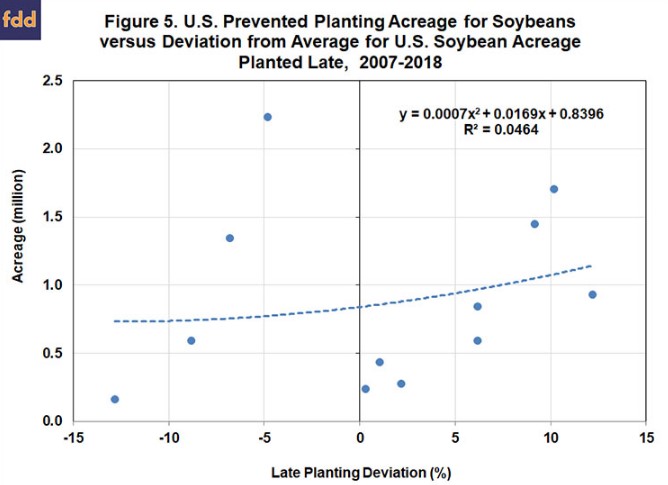
The Farm Service agency (FSA) of the USDA has collected data on prevented plantings only since 2007, so the available sample of years for analysis of prevented plant acreage is limited. Figures 4 and 5 show the relationship between total prevented plantings for corn and soybeans, respectively, in relation to the level of late corn planting over 2007 through 2018. Despite the small sample size, there is a surprisingly strong relationship shown in Figure 4 between total prevented plantings for corn and late planting. When late planting is 10 percent higher than average, the estimated regression line predicts total prevented plantings for corn of about 2.25 million acres. This can be compared to the average prevented plantings over the entire sample period of 1.6 million acres. Alternatively, in the three years when late planting was near or larger than 10 percent (2009, 2011, and 2013), the average level of prevented corn planting was 2.8 million acres, which is 1.2 million acres more than the average level of prevented plantings. Figure 5 shows a much poorer fit for soybean prevented plantings, although the direction of the relationship is positive, similar to corn. In particular, for 2009, 2011, and 2013, the three years when late corn planting was near or larger than 10 percent, the average level of prevented soybean planting was 1.4 million acres, which is 0.5 million acres more than the average level of prevented soybean plantings for this period.
Like in our analysis of the impact of corn late planting on corn trend yield deviations last week (farmdoc daily,
May 1, 2019), the analysis here suggests that a key issue for projecting 2019 corn and soybean acreage changes is whether corn late planting will be 10 percent or more above average. The issue can be framed by first noting that corn planting progress was 23 percent on May 5th. The critical threshold is 100-17-10 = 73 percent total planting progress on May 20th (17 percent is average late planting). This implies the need to plant at least 50 percent of the corn crop in the 14 days between May 5th and May 20th. Our research (farmdoc daily,
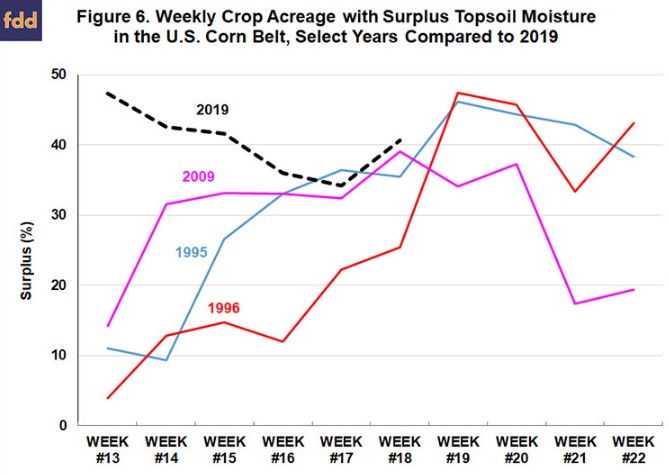
April 17, 2019) indicates that it is certainly possible to plant half the corn crop in 14 days. In fact, this is more than the needed number of calendar days. If farmers can plant the entire U.S. Corn Belt in 14 days, this implies 7.1 percent planted per day. Therefore, in theory, only 7 days out of the 14 over May 5th through May 20th would be sufficient to achieve the 50 percent planting progress needed to reach a total of 73 percent planted by May 20th (10 percent above average late planting). However, this is counter-balanced by the extremely wet topsoil conditions that currently exist in the Corn Belt. Figure 6 shows weekly values of topsoil moisture surplus in the Corn Belt during April (weeks #13 – #17) and May (weeks #18 – #22) for 2019 to date and the three years since 1995 that had the largest amount of late planting. The figure shows that 2019 to date has been wetter than 1995, 1996, and 2009 with one exception. By this historical standard, 2019 was very wet in April and looks to continue very wet through at least mid-May, particularly given the rains (and snow!) that have occurred in recent days. The implication is that it is going to be difficult to get the needed 7 suitable field days throughout the Corn Belt before May 20th. The bottom-line is that there continues to be a high probability of late corn planting in 2019 being 10 percent or more above average.
Implications
The impact of late planting on projections of the U.S. corn and soybean planted acreage is an important question right now due to the very wet and/or cold conditions so far this spring through much of the Corn Belt. We estimate the relationship of late corn planting to corn and soybean planted acreage and prevented plantings in this article. If late corn planting is 10 percent or more above average, we find that the chance of corn planted acreage decreasing is 83 percent and the average decrease is 1.4 million acres. The level of prevented plantings for corn is about 1.2 million acres larger than average when late planting is near 10 percent or more above average. This indicates that there is a reasonably high chance that planted acreage of corn will decline 2-3 million acres from expectations based on the March 30 USDA Prospective Plantings report. Likewise, we find that when late corn planting is 10 percent or more above average that the chance of soybean planted acreage increasing is 83 percent and the average increase is 0.9 million acres. However, the level of prevented plantings for soybeans also increases, offsetting much of the acreage switch. This indicates there is a reasonably high chance that planted acreage of soybeans will not change much compared to expectations based on the March 30 USDA Prospective Plantings report. It should be noted that changes to corn and soybean planted acreage could be even larger if planting conditions do not improve substantially in the next two weeks. Finally, corn and soybean acreage changes could also be impacted by policy changes made in response to reaching or not reaching a trade deal with China.