By Adele Harty
Mineral consumption is key to determining whether or not nutrient requirements are being met, as was outlined in Mineral Consumption: It Matters!. The mineral consumption calculator was developed as a tool to make monitoring and tracking consumption easier, while being an indicator when over-or-under-consumption occurs.
The mineral consumption calculator can store data from multiple pastures throughout the year to have a complete picture of mineral consumption over time, with a few inputs from you. The data can be downloaded into a .csv file and saved for future use and analysis. Follow the steps below to get started.
LAUNCH CALCULATOR
Mineral Calculator Tab
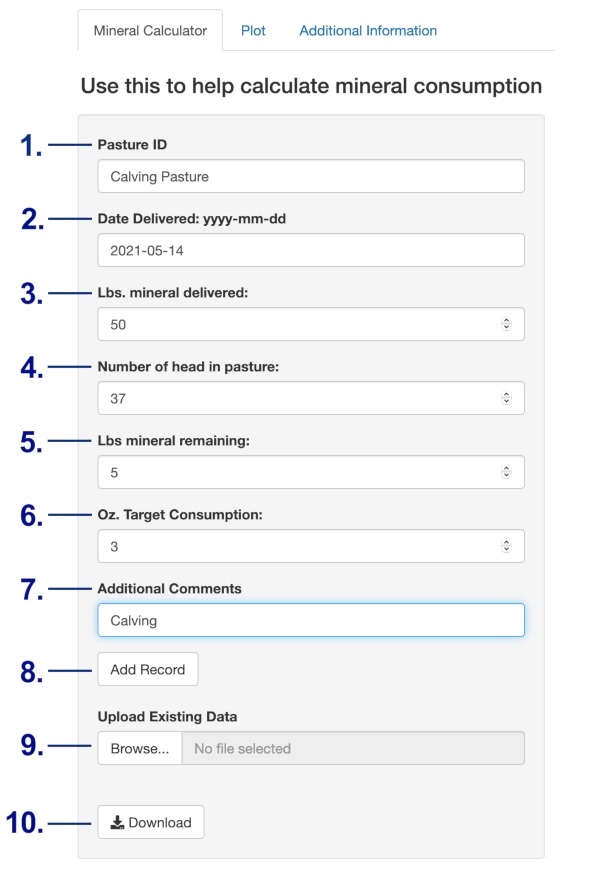
Figure 1. Example "Mineral Calculator" inputs.
To begin entering your data, select the “Mineral Calculator” tab and enter the necessary input information.
INPUTS
- Pasture ID: The name you associate with the pasture. For example, “Calving Pasture.”
- Date Delivered: Record the date that the mineral is delivered, stating the four-digit year, two-digit month and two-digit day. For example, “2021-05-14.”
- Lbs. mineral delivered: Record how many pounds of mineral was delivered on this day. If full bags are used, multiply number of bags by 50 to get total pounds delivered.
- Number of head in the pasture: If pairs are grazing, use the number of pairs. If yearlings are grazing, use the total number of head.
- Lbs. of mineral remaining: Using the information on the “Additional Information” tab in the calculator, you can estimate approximate number of pounds remaining in the mineral feeder, based on volume. This is not exact, but it is an estimate. If the feeder is empty, enter “0” here.
- Oz. target consumption: Recommended intake from the feeding directions on the mineral tag. For yearlings, use the recommended intake number listed. If there is a range, use the lower end of the range. For pairs, use 1.5 times what is listed on the tag to account for mineral consumption by the calf. The intake will increase as the calf grows but using half of what the cow will eat is a good starting point. For example, if the tag says it is a 3 oz. intake mineral, but will be fed to pairs, put 4.5 oz. in this section to account for the consumption by the calves.
- Additional Comments: This is the place to add notes about temperature, precipitation, moves, etc. that could be impacting intake. Also, if intake is lower than it should be, you can make notes of changes made to increase intake.
- Add Record: Click the “Add Record” to add the information to the table.
- Upload Existing Data: Browse to select a .csv file that was downloaded previously to upload and add new data points. Don’t forget to download after new data points have been added. The calculator will not store your data, you must download it.
- Download: Download the data to a location that will be easy to access next time mineral is delivered.
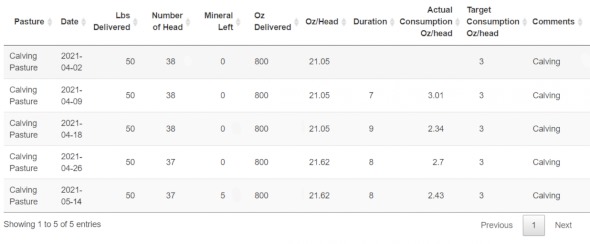
Figure 2. Example “Mineral Calculator" results.
RESULTS
Once you have entered your inputs, click the"Add Record" button, and your results will display in a table that you can use to compare and contrast records (Figure 2). The calculator will determine actual consumption once two entries have been made. The consumption is based on duration, pounds delivered and pounds remaining. These data points will be plotted, so you can evaluate seasonal intake variability and make necessary adjustments.
Additional Tabs
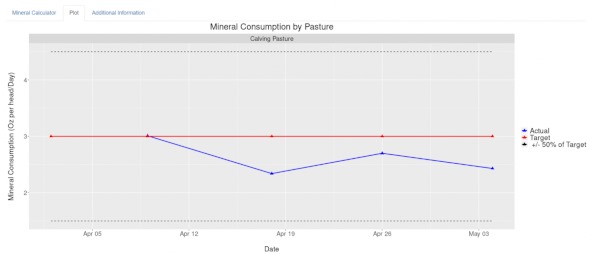
Figure 3. Example “Plot” outputs.
PLOT
Once two or more records are added for the same pasture, click on the “Plot” tab to create a plot of mineral consumption (Figure 3). The red line indicates the target, the dotted lines are +/- 50% of target, and the blue line is actual consumption.
Source : sdstate.edu