By Gary Schnitkey and Jim Baltz
Department of Agricultural and Consumer Economics
University of Illinois
Carl Zulauf
Department of Agricultural, Environmental and Development Economics
Ohio State University
Most nitrogen fertilizers likely are in place for the 2022 production of spring crops in North America, albeit at much higher prices than in 2021. However, the continuing Ukraine-Russia war can limit fertilizer supplies for the crop that will be planted in South America later in 2022, leading to further upward price pressures for fertilizer used in North America for the 2023 production year. Herein, we detail the international trade of nitrogen fertilizers before hostilities in Ukraine-Russia began. Then we evaluate possible changes in supply resulting from the Ukraine-Russia War.
Data on International Nitrogen Trade
The Food and Agriculture Organization (FAO) of the United Nations maintains a database of the use, production, and trade of the three major fertilizer nutrients: nitrogen, phosphate, and potash. Table 1 shows the nitrogen data for 2019, the last year in which data is available. Nitrogen statistics are given for the top 20 countries in nitrogen use, along with a total for all countries in the European Union (EU). Values in the table are stated in terms of million metric tons of actual N, and include:
- Agricultural use — the estimate of the use of nitrogen fertilizer,
- Production— production of nitrogen fertilizer in the country,
- Production as a % of use – low values indicate that a country is highly reliant on imports,
- Exports — the amount of nitrogen exported out of the country,
- Imports — the amount of nitrogen imported into the country, and
- Net exports — equals exports minus imports. Positive values indicate that a country exports more than it imports. Generally, those countries with the largest values are the largest nitrogen source for other countries. Negative values mean that the country imports more than they export. Generally, those countries with the largest negative values are more reliant on nitrogen production from countries.
Data are collected through questionnaires administered by the FAO. These are estimates of fertilizer use, production, and trade. As such, they will vary from actual values and other sources. While estimates, the FAO values provide a valuable gauge of the relative size of importers and exporters. Data shown in Table 1 are for 2019. Analysis of earlier years indicates that the same countries remain as large importers or exporters.
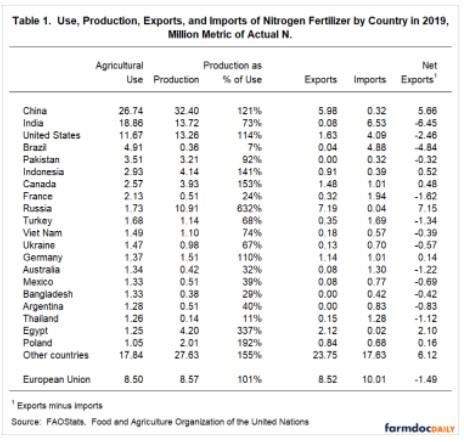
Countries are arranged from highest to lowest agricultural use. Highlights of the top four countries are:
- China used 26.74 million tons of nitrogen in 2019, while it produced 32.40 million tons. China’s production was 121% of use, meaning that China produced more nitrogen than it used. Exports from China were estimated at 5.98 million tons, imports at .32 million tons, giving net exports of 5.66 million tons. China is the largest user and producer of nitrogen by wide margins. China is the second-largest net exporter of nitrogen.
- India used 18.86 million tons and produced 13.72 million tons of nitrogen. Net exports equal -6.45 million tons, making India the largest importer of nitrogen fertilizers.
- The United States used 11.67 million tons of nitrogen fertilizer and produced 13.26 million tons. Net exports were -2.46 million tons, indicating that the U.S. was an importer of nitrogen. Note that FAO reports use at a lower value for agricultural use than that given in the Mineral Commodity Summary 2021 publication by the United States Geographical Survey (USGS), another source of nitrogen statistics for the United States. Both USGS and FAO have the U.S. importing nitrogen. Difference between the two sources likely deal with definitions, and the fact that USGS imputes agricultural use.
- Brazil used 4.91 million tons and produced .36 million tons. Net exports of Brazil are -4.84 million tons. Brazil only produces 7% of its nitrogen fertilizer.
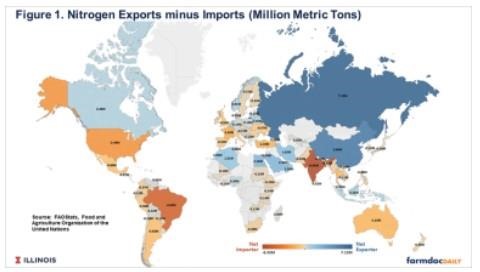
Figure 1 shows net exports of nitrogen for 2019. Countries in blue are net exporters meaning that nitrogen moves from that country to other counties. The nine countries with over a 1.0 million tons of net exports:
- Russia with 7.12 million tons. Russia has a 21% share of exports across countries.
- China with 5.66 million tons and a 17% share of exports,
- Qatar with 2.26 million tons and a 7% share of exports,
- Saudi Arabia with 2.12 million tons and a 6% share of exports,
- Egypt with 2.10 million tons and a 6% share of exports,
- The Netherlands with 1.68 million tons and a 5% share of exports,
- Iran with 1.62 million tons and a 5% share of exports,
- Oman with 1.59 million tons and a 5% share of exports,
- Algeria with 1.21 million tons and a 4% share of exports.
Counties in orange in Figure 1 are importers. In 2019, the countries that were the largest importers were:
- India with 6.45 million tons representing a 19% share of imports,
- Brazil with 4.84 million tons representing 14% share of imports,
- United States with 2.46 million tons representing 7% share of imports,
- France with 1.62 million tons reprinting a 5% share of imports,
- Turkey with 1.34 million tons representing a 4% share of imports,
- Thailand with 1.12 million tons representing a 3% share of imports, and
- Australia with 1.22 million tons representing a 3% share of imports.
Impacts of Ukraine-Russia War on Nitrogen Trade
The Ukraine-Russia war could have significant impacts on global nitrogen fertilizer trade. Fertilizer exports from Russia, the world’s leading nitrogen fertilizer exporter, could be reduced because of the war. This could occur via direct disruptions to the physical flow of goods due to the war as well as sanctions on Russian exports by trade partners. How much of a reduction this will create remains to be seen. However, given Russia’s 21% share of exports, significant reductions would be difficult for other major exporters to completely offset. Alternatively, some countries could ban Russian fertilizer imports while others do not, causing substantial changes in nitrogen flows worldwide. In either case, nitrogen fertilizer prices would increase, with explosive increases more likely as the extent to which Russian export flows are limited increases.
Second, nitrogen fertilizer production in the European Union likely will be reduced. The EU now has a stated goal of eliminating natural gas imports from Russia, with Russia supplying 40% of western Europe’s natural gas needs. Natural gas is a primary input into the production of nitrogen fertilizers. If the goal is upheld, the reduction in natural gas available likely will divert natural gas use from making nitrogen fertilizers to heating homes. Natural gas prices will increase, making nitrogen production from Europe costly compared to other places in the world. In 2019, the E.U. produced 8.57 million metric tons of nitrogen fertilizer. Reductions could result in the need to import nitrogen from outside the EU, with a limited appeal of receiving fertilizer from Russia.
Third, nitrogen fertilizer production in other countries could be reduced as natural gas currently used in fertilizer production in those nations is used instead to supply Western Europe’s natural gas needs. Take Norway as an example. Norway is not part of the European Union and has relatively abundant natural gas supplies that have been used in nitrogen fertilizer production (.51 million tons of exports in 2019). Therefore, natural gas from Norway could be diverted from fertilizer production and instead go to western Europe.
There likely will be larger and more complex impacts of the Ukraine-Russia war on nitrogen fertilizer production than those outlined above. Suffice it to say:
- Nitrogen exports from Russia could be reduced.
- Western Europe could see sharp reductions in nitrogen fertilizer production.
- Countries outside of the European Union could reduce nitrogen fertilizer production to provide Western Europe with natural gas.
Nitrogen producers outside the above supply-deprived countries will likely expand production, partially offsetting lost production. Still, production constraints exist, with a limited number of nitrogen-production facilities available, all of which have production limits. As a result, large reductions likely cannot be made up, which will lead to price increases to induce rationing.
Impacts on North and South America
Brazil imports almost all of its nitrogen fertilizers, with 21% of those imports coming from Russia (farmdoc daily, March 17, 2022). A reduction in Russian imports will cause Brazil to search for nitrogen fertilizers. Brazil could add supplies from its other significant suppliers of fertilizer: China, Qatar, Algeria, and Iran (farmdoc daily, March 17, 2022). Brazil could also find additional sources from Western Hemisphere countries, including Trinidad and Tobago and Canada, which supply the United States with nitrogen fertilizer. Potentially, Brazil could import nitrogen fertilizers from the United States.
The United States can produce most of its nitrogen needs within the country. Still, the United States requires imports, with major origin countries being Trinidad and Tobago, Canada, and Venezuela (see farmdoc daily, March 17, 2022). Those countries have the potential to supply Brazil. Moreover, U.S. fertilizer producers will have opportunities to provide Brazil with nitrogen. To keep nitrogen fertilizer in the U.S., fertilizer prices in the U.S. must rise to the point where fertilizer staying in the United States matches the opportunities to sell to Brazil.
Other countries in the Western Hemisphere also have similar issues as Brazil. Argentina, for example, imports much of its nitrogen fertilizer, likely adding additional needs for fertilizer.
The above discussion focused on the Western Hemisphere. Countries in the Eastern Hemisphere could also look for additional fertilizer sources. Again, reductions in export flow from Russia combined with lower supplies from Western Europe could cause some Eastern Hemisphere countries to look for sources from the Western Hemisphere.
Summary
Reductions in the supply of nitrogen fertilizers from Russia, the E.U. and other countries will have rippling effects worldwide. While it is doubtful that sanctions will interrupt a large part of nitrogen exports, some reduction seems likely. How big the price response depends on reductions from Russia and Western Europe. A significant supply decrease from Russia and Western Europe will result in a chain reaction of events that will likely increase worldwide prices. Farmers in the United States should expect to see increasing nitrogen fertilizer prices.
Source : illinois.edu