By Scott Irwin and Todd Hubbs
Department of Agricultural and Consumer Economics
University of Illinois
Soybean yield forecasts contained in May, June, and July WASDE reports from the USDA provide important information to market participants. The forecasts are based on a crop weather model developed and maintained by the World Agricultural Outlook Board (WAOB). In a recent farmdoc daily article (July 9, 2020), we described the WAOB crop weather model for soybeans and replicated the generation of 2020 yield forecasts. We also specified an alternative crop weather model for soybeans in this farmdoc daily article (June 25, 2020) and used the model to generate 2020 trend yield projections for soybeans based on different sample periods. The purpose of today’s article is to evaluate the accuracy of both crop weather models for making early season forecasts of the U.S. average yield of soybeans. This extends the evaluation of WAOB early season accuracy of soybean yield forecasts found in this farmdoc daily article (May 7, 2015). The analysis also parallels the evaluation of crop weather forecasts for corn found in a farmdoc daily article last week (July 16, 2020).
Analysis
We begin by describing the WAOB crop weather model used to generate WASDE soybean yield forecasts in May through July each year. As detailed in Westcott and Jewison (2013), the WAOB crop weather model is a “Thompson-style” regression model. Specifically, the model of U.S. average soybean yield was originally estimated using data for 1988 through 2012 and included the following explanatory variables: i) a time trend variable to represent technological change, ii) a dummy variable for 2003 to represent aphid-related yield loss, and iii) June precipitation shortfall, iv) July-August average precipitation, and v) July-August average temperature. The WAOB soybean model does not include planting progress, different than the WAOB corn model (farmdoc daily, July 2, 2020). The weather data were collected for seven key soybean-producing states (Iowa, Illinois, Indiana, Ohio, Missouri, Minnesota, and Nebraska). These seven states typically represented about 70 percent of U.S. soybean production when the model was originally developed. An aggregate measure for the seven states was constructed using harvested soybean acres to weight state-specific weather observations.
Since extreme weather deviations from normal in June can have large impacts, as seen in 2012 and in 1988, the model uses a measure of the June precipitation shortfall from average in years when June precipitation is in the lowest 10-percent tail of its historical distribution. Since much of soybean reproduction occurs in July-August, both temperature and precipitation from those months were included in the model. Note that temperature and precipitation are averaged across July and August.
Our objective is to conduct an “out-of-sample” forecasting exercise using the WAOB crop weather model over 2013-2019. We start the evaluation in 2013 since this is the first year that the WAOB model was used to generate early season soybean yield projections. Since published WASDE soybean yield forecasts for May, June, and July are based on the crop weather model, we collected the soybean yield forecasts published in these years. Even though WASDE yield forecasts are switched to NASS survey-based estimates in August, for consistency we also assess the forecasting performance of the WAOB model in August. Note that model forecasts in August are the same as in July because July-August average precipitation and temperature are still unknown at the assumed time of making the forecast.
Panel A of Table 1 contains the WAOB crop weather model forecasts for May-August over 2013-2019, along with the NASS August forecast and the USDA final yield estimate each year. We include NASS yield forecasts for August, as these are considered the “gold-standard” when projecting soybean yields. In addition, we report the WAOB model forecasts for May-July 2020. We could not compute the August 2020 WAOB model forecast because we do not yet have access to the July and August weather data for 2020. The early season WAOB model forecasts start at 44.5 bushels per acre in May 2013 and increase to 49.5 bushels per acre in May 2020. The 5.3 bushel increase in forecasts over this period represents an average increase in yield forecasts of 0.66 bushels per year. Note that in most years the published WAOB yield forecast is the same during May-August, which makes sense because the June precipitation shortfall is assumed to be zero and actual July-August weather variables are not available.
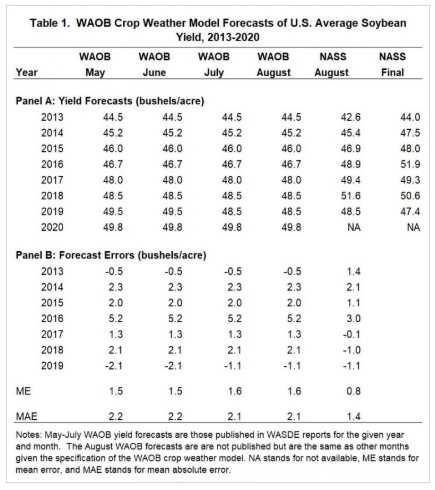
Panel B of Table 1 contains the WAOB yield forecast errors for May-August over 2013-2019. The errors are computed by subtracting the forecasts found in Panel A from the final USDA estimates, also found in Panel A. Of course, 2020 errors cannot be computed because final yield is not yet available. The accuracy record of the WAOB model is mixed, with some May forecasts near the final estimate (2013 and 2017) and some relatively far from the final estimate (2014 and 2016). This is not unexpected for early season forecasts, as key weather information is not yet available. It is interesting to observe that the vast majority of the forecast errors in May-August are positive, which implies that the WAOB model under-estimated the final soybean yield. The mean errors (ME) presented at the bottom of Table 1 indicate that the average level of under-estimation (bias) ranged from 1.5 to 1.6 bushels. NASS yield forecasts in August also under-estimated on average over 2013-2019, but at 0.8 bushels this was the smallest bias of the forecasts considered in Table 1.
A key measure of forecast accuracy is mean absolute error (MAE), which is simply the average of the absolute value of the forecast errors presented in Panel B of Table 1. This is a measure of how close the forecast comes to the final USDA estimate, irrespective of whether the forecast is too high or too low. The MAE for the WAOB crop weather forecasts over 2013-2019 ranged between 2.1 and 2.2 bushels per acre. In percentage terms, this represents 4.4 to 4.7 percent of the forecast levels reported in Panel A of Table 1, which is reasonably accurate considering the simplicity of the WAOB crop weather model. Furthermore, this represents an improvement in percentage accuracy compared to the 1993-2014 period, as reported in this earlier farmdoc daily article (May 7, 2015). Finally, the NASS August yield forecast has the smallest MAE (1.4 bushels) of the forecasts found in Table 1. This is not surprising because NASS forecasts are based on thousands of farm operator and objective yield samples, and one would expect forecasts based on such extensive information to be more accurate.
The next step of the analysis is to generate soybean yield forecasts using the alternative crop weather model presented in this farmdoc daily article (June 25, 2020). We are interested whether this alternative crop weather model is more or less accurate than the WAOB model. This crop weather model relates the U.S. average soybean yield to a linear trend, late planting, quadratic functions of July and August precipitation, and linear functions of July and August temperature as explanatory variables. The weather variables are acreage weighted-averages for 10 states in the Corn Belt. Note differences compare to the WAOB model.
We use the following procedure to generate soybean yield forecasts for this alternative crop weather model:
- Estimate the crop weather model coefficients using data from 1988-2012.
- Compute May-August 2013 forecasts by plugging in known variables at the time of the forecast is assumed to be made, and projecting values for the remaining variables. The trend variable is always the index value of the forecast year. When projections are necessary for linear variables (late planting, July and August temperature), sample averages over 1988-2012 are used. When projections are necessary for non-linear variables (July and August precipitation), a Monte Carlo simulation is used in order to reflect the quadratic impact on yield forecasts.
- Repeat the process by adding one year to the estimation sample period and computing May-August forecasts for the following year.
Panel A of Table 2 contains the alternative crop weather model (IH) forecasts for May-August over 2013-20202, along with the NASS August forecast and the USDA final yield estimate each year. We could not compute the July and August 2020 model forecasts because we do not yet have access to the July and August weather data for 2020. The early season IH model forecasts start at 44.5 bushels per acre in May 2013 and increase to 49.0 bushels per acre in May 2020. The 4.5 bushel increase in forecasts over this period represents an average increase in yield forecasts of 0.57 bushels per year. Note that that IH model forecasts differ across months because different combinations of variables are known vs. projected each month.
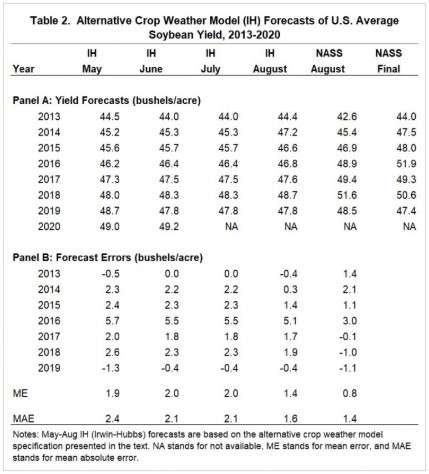
Panel B of Table 2 contains the alternative IH yield forecast errors for May-August over 2013-2019. Once again, the errors are computed by subtracting the forecasts found in Panel A from the final USDA estimates, also found in Panel A. Like the WAOB model, the vast majority of the forecast errors in May-August are positive, which implies that the IH model under-estimated the final soybean yield. The mean errors (ME) presented at the bottom of Table 2 indicate that the average level of under-estimation (bias) ranged from 1.4 bushels in August and to 2.0 bushels in June and July. The level of bias for the IH and WAOB crop weather models were similar. The mean absolute error of the alternative IH crop weather model ranged from 1.6 to 2.4 bushels per acre. In percentage terms, this represents 3.4 to 5.1 percent of the forecast levels reported in Panel A of Table 2.
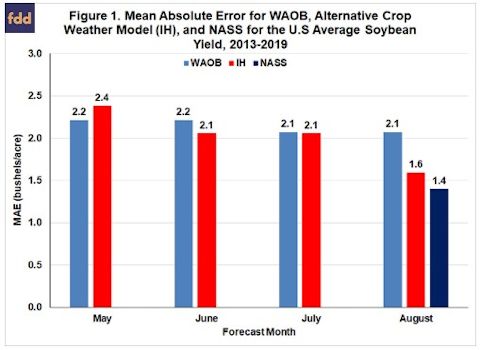
Figure 1 presents the month-by-month mean absolute errors for the WAOB crop weather model, the IH alternative crop weather model, and the NASS forecast in August. Three results stand out. First, the accuracy of the WAOB and IH crop weather models is more or less the same in May, June, and July. Second, the IH crop weather model in August is substantially more accurate than the WAOB model forecast. This may be due to the IH model disaggregating July and August weather observations into separate variables. Third, the NASS forecast in August is more accurate than either of the crop weather model forecasts, but not by a large margin compared to the IH model, only 0.2 bushels per acre. This is a surprising result and different than what we found for corn (farmdoc daily, July 16, 2020). NASS soybean forecasts are not the clear victor in terms of August forecast accuracy.
Implications
Crop weather models are widely used to make early season soybean yield forecasts. We examine the accuracy of forecasts from two crop weather models over 2013-2019 in this article. The first is the model developed and maintained by the World Agricultural Outlook Board (WAOB) of the USDA. It is used to generate forecasts for the May, June, and July WASDE reports. The second is an alternative but similar crop weather model that we developed and presented in an earlier farmdoc daily article (June 25, 2020). We find that nearly all of the early season forecasts from the models during this eight-year period were too low, with the bias ranging from about 1.5 to 2.0 bushels per acre. In terms of mean absolute forecast error, the two crop weather models were about equally accurate in May-July, but our crop weather model was clearly more accurate in August. Consequently, in horse-race terms, the advantage goes to our alternative crop weather model. Finally, the NASS forecast in August is more accurate than either crop weather model, but the advantage is not very large compared to our crop weather model, only 0.2 bushels per acre.
Source : illinois.edu