By Scott Irwin
Department of Agricultural and Consumer Economics
University of Illinois
There is considerable interest in the likely magnitude of South American corn and soybean production in 2021, with much of the current focus on weather developments influencing yield prospects.
The December USDA WASDE forecasts for Brazil corn and soybean production are 4.330 and 4.887 billion bushels, respectively. Argentina corn and soybean production projections currently sit at 1.968 and 1.874 billion bushels, respectively. The development of a La Niña episode in the latter half of 2020 has created a significant amount of discussion on the possible yield impacts for both crops in Brazil and Argentina. The purpose of this article is to analyze Brazil and Argentina corn and soybean yields in previous years of La Niña episodes to determine if trend yield expectations should be altered due to the current La Niña episode. This is the second in a two-part series on South American corn and soybean yield prospects (farmdoc daily,
December 16, 2020) and updates an earlier analysis of La Niña and corn and soybean yields in Brazil and Argentina (farmdoc daily,
February 22, 2017).
Analysis
There is considerable discussion about the potential impact of the current La Niña episode on South American growing season weather and the resulting effect on crop yields. The question is: Should the potential for trend yield deviations be adjusted due to this episode? We start with a brief discussion of what constitutes an El Niño/ La Niña episode and then examine the historical record of corn and soybean yields in both countries in years with events similar to the current one.
As defined by the
National Oceanic and Atmospheric Administration (NOAA), “El Niño and La Niña are opposite phases of a natural climate pattern across the tropical Pacific Ocean that swings back and forth every 3-7 years on average. Together, they are called ENSO, which is short for El Niño-Southern Oscillation. The ENSO pattern in the tropical Pacific can be in one of three states: El Niño, Neutral, or La Niña. El Niño (the warm phase) and La Niña (the cool phase) lead to significant differences from average ocean temperatures, winds, surface pressure, and rainfall across parts of the tropical Pacific. Neutral indicates that conditions are near their long-term average.” The definition encompasses four weather factors (temperature, wind, rainfall and surface pressure) and a rather vague description of the geographical location of these factors. The definitions are further refined by
L’Heureux (2014) as:
El Niño: A warming of the ocean surface, or above-average sea surface temperatures (SST), in the central and eastern tropical Pacific Ocean. Over Indonesia, rainfall tends to become reduced while rainfall increases over the tropical Pacific Ocean. The low-level surface winds, which normally blow from east to west along the equator (“easterly winds”), instead weaken or, in some cases, start blowing the other direction (from west to east or “westerly winds”).
La Niña: A cooling of the ocean surface, or below-average sea surface temperatures (SST), in the central and eastern tropical Pacific Ocean. Over Indonesia, rainfall tends to increase while rainfall decreases over the central tropical Pacific Ocean. The normal easterly winds along the equator become even stronger.
Neutral: Neither El Niño or La Niña. Often tropical Pacific SSTs are generally close to average
These definitions center on sea surface temperatures in the eastern and central Pacific Ocean and are the popular way to describe the ENSO episodes. For our purposes, we are interested in “strong” La Niña episodes. We define a strong La Niña episode as occurring when the Oceanic Niño Index (ONI-three month centered mean) in the central and eastern Pacific region (Niño 3.4 region) reaches 1.0C below average. The strength of the La Niña is measured by the magnitude of the deviation in the three-month centered mean temperature from the average temperature, where average temperature is based on 30-year base periods updated every five years. The official ONI data from January 1960 through October 2020 provides measures of the temperature deviations and indicates the occurrence of a La Niña episode at the end of 2020.
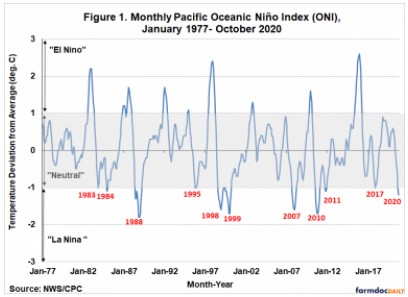
Since our interest is in La Niña episodes preceding the South American growing season, we specifically consider episodes that occur in the portion of the pre-plant period extending from July to December of the calendar year previous to the year of harvest, regardless of how and when the episode eventually transitioned. We therefore define a La Niña episode as one in which the actual three-month running mean temperature falls below the long-run average temperature by at least 1.0C for at least one month during July through December. The eleven La Niña episodes over January 1977 through October 2020 that meet these two criteria are labeled in Figure 1. On average, La Niña episodes of this type have occurred once every four years. Readers should note that other measures of La Niña episodes may have relevance that we have not considered, and these other measures may provide different results.
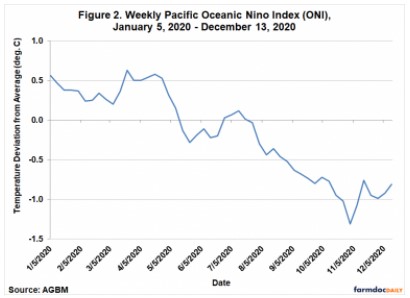
Weekly observations for the ONI are also available and presented for 2020 in Figure 2. This more up-to-date data shows that the current La Niña episode has weakened marginally since peaking in early November, but nonetheless has remained close to the -1.0C cutoff point.
Tables 1 and 2 presents more detail on the conditions during each of the nine previous La Niña episodes that meet our definition, and the trend deviation for the average corn and soybean yield in the following year for each country. Specifically, for each of those episodes, we show the peak temperature anomaly, the month of the peak anomaly, the crop year following the peak anomaly, and the yield deviation from trend in those crop years.
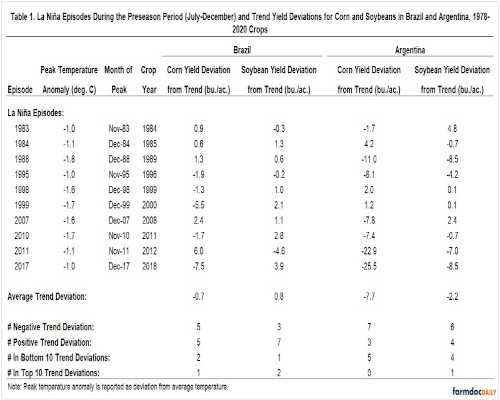
The pattern of average corn and soybean yields in years following a strong pre-season La Niña episode provides mixed information for yield expectations. For Brazil:
- The average corn yield in the ten years was 0.7 bushels below trend. The average soybean yield was 0.8 bushels above trend.
- The deviation from trend for corn ranged from -7.5 bushels to 6.0 bushels. The deviation from trend for soybeans ranged from -4.6 bushels to 3.9 bushels.
- The average corn yield was below trend 50 percent of the time (five years), and above trend 50 percent of the time. The average soybean yield was below trend 30 percent of the time (three years) and above trend 70 percent of the time.
- Of the bottom 10 years below trend for corn since 1978, two followed a strong La Niña episode. Of the top 10 years above trend for corn since 1978, one followed a strong La Niña episode.
- Of the bottom 10 years below trend for soybeans since 1978, one followed a strong La Niña episode. Of the top 10 years above trend for soybeans since 1978, two followed a strong La Niña episode.
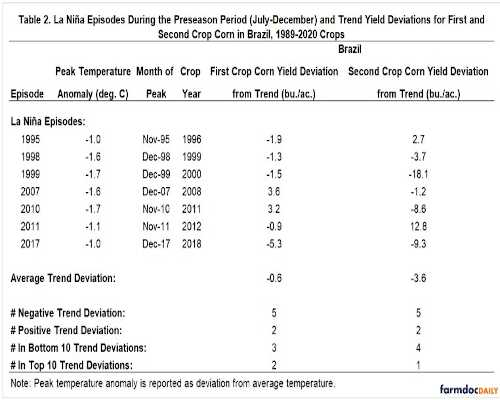
- Table 2 provides analysis of first and second crop corn yield trend deviations from 1989-2020. La Niña episodes occurred in seven years during the time span. The average first crop corn yield in those seven years was 0.6 bushels below trend. The average second crop corn yield was 3.6 bushels below trend. Yield was below trend following five of the seven La Niña episodes for both first and second crop corn. Furthermore, three and four of the bottom 10 trend deviations followed La Niña episodes in first and second crop corn, respectively.
For Argentina:
- The average corn yield in the ten years was 7.7 bushels below trend. The average soybean yield was 2.2 bushels below trend.
- The deviation from trend for corn ranged from -25.5 bushels to 4.2 bushels. The deviation from trend for soybeans ranged from -8.5 bushels to 4.8 bushels.
- The average corn yield was below trend 70 percent of the time (seven years), and above trend 30 percent of the time. The average soybean yield was below trend 60 percent of the time (six years) and above trend 40 percent of the time.
- Of the bottom 10 years below trend for corn since 1978, five followed a strong La Niña episode. Of the top 10 years above trend for corn since 1978, none followed a strong La Niña episode.
- Of the bottom 10 years below trend for soybeans since 1978, four followed a strong La Niña episode. Of the top 10 years above trend for soybeans since 1978, one followed a strong La Niña episode.
Implications
With current U.S. and world corn and soybean supplies relatively tight, the size of the 2021 Brazilian and Argentine crops will be very important in determining the direction of crop prices over the next year or more. Using an expanded data set compared to our previous analysis (farmdoc daily, February 22, 2017), we find that the history of corn and soybean yields in Brazil and Argentina conditioned on a strong La Niña episode, such as the one currently underway, provides some useful information about the direction and magnitude of the trend deviation to expect in 2021. Perhaps the most important finding is the slim chance of unusually good corn and soybean yields in either country following a strong La Niña episode. Beyond that, there is variation by crop and country. In Brazil, first crop corn and national soybean yield appear to have minimal risk of yields substantially below trend. There is enhanced risk of below trend yield for second crop corn in Brazil, with an average trend deviation of -3.6 bushels. The most notable yield impacts historically are observed for Argentina, where the probability of below trend yields is 60-70 percent following a strong La Niña episode. The average trend deviation is -7.7 bushels for corn and -2.2 bushels for soybeans. Readers should note that other measures of La Niña episodes that we have not considered may generate different results.
What is the bottom-line of the analysis for expectations for corn and soybean crops in Brazil and Argentina in 2021? In the first article of this two-part series , we estimated 2021 trend yields for corn and soybeans in Brazil of 94.9 and 50.4 bushels per acre, respectively. Given the ongoing strong La Niña episode, we would not change the soybean yield expectation for Brazil but believe it would be prudent to drop the corn yield expectation 1-2 bushels below trend. In the same article, we estimated 2021 trend yields for corn and soybeans in Argentina of 127.4 and 44.1 bushels per acre, respectively. The analysis suggests lowering the corn yield expectation by 7-8 bushels below trend and the soybean yield 2-3 bushels below trend. If cuts in yields of this magnitude are realized, total corn and soybean production in Brazil and Argentina for 2021 would be reduced over 200 and 100 million bushels, respectively.
Source : illinois.edu