By Jonathan Coppess and Krista Swanson
Department of Agricultural and Consumer Economics
University of Illinois
The 1980s was a devastating time for American farmers, considered the worst economic crisis since the Great Depression (Barnett, 2000; Fite, 1992). As discussed previously, the early 1970s provided the catalyst for the 1980s crisis via the Nixon soybean embargo and Russian grain transactions in wake of currency changes, inflation and other changes (farmdoc daily, May 30, 2019). This article continues the look back to this consequential decade, reviewing the other side of the 1970s.
Background
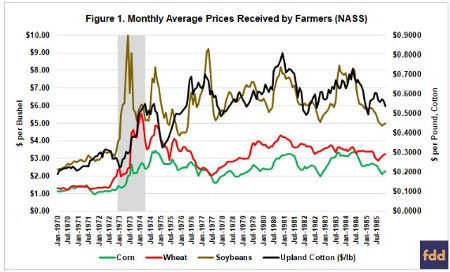
A catalyst is not the same as causation; by definition, something that is a catalyst “provokes or speeds significant change or action” but isn’t necessarily the cause of it (Merriam-Webster). Where market prices provide a driving force, Figure 1 offers an overview by illustrating the monthly average prices received by farmers for corn, wheat, soybeans and upland cotton, as reported by USDA’s National Agricultural Statistics Service (Quick Stats) for 1970 through 1985. The price spike in the early Seventies is clear across the four commodities.
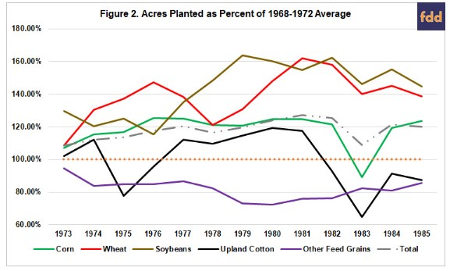
Higher prices provided pressure to increase production and planted acres, which was reinforced by policy changes in the 1973 Farm Bill and encouraged by the Nixon Administration. Figure 2 provides some indication as to the increase of planted acres for each commodity and all of the commodities combined. The figure compares the acres planted in each year as a percentage of the 5-year average acres planted from 1968-1972. By this measure, wheat and soybeans added the most acres, followed by corn; the other feed grains (barley, oats, rye and sorghum) decreased acres. Overall, total acres planted (gray dotted line) increased after the parity allotment system was terminated in 1973.
Discussion
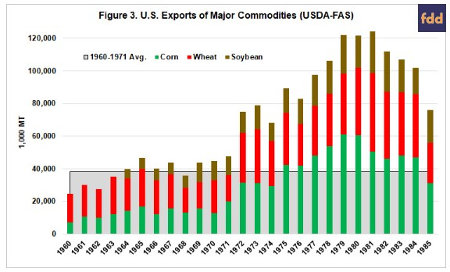
Exports were a key factor in the price spike. Figure 3 illustrates USDA Foreign Agricultural Service (FAS) data on exports of corn, wheat and soybeans during the years encompassing this period (1960 to 1985). The data in Figure 3 is from the Production, Supply and Distribution datasets (PS&D). The change in exports beginning in 1972 and 1973 stand out compared to the years preceding them (average from 1960 to 1971 in gray area), but also that exports continued to increase throughout the 1970s, peaking in 1981.
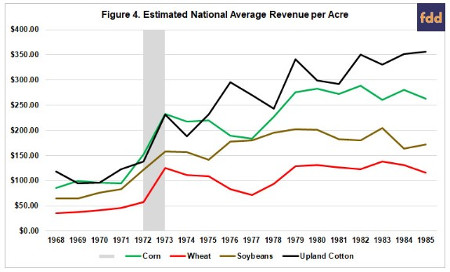
While market prices became more volatile (Figure 1), yields continued to increase which impacted farm income, generally helping to improve revenue per acre. The national average yields, multiplied by the marketing year average prices (MYA), provide an estimate of the national average revenue farmers were receiving. Figure 4 illustrates the estimated national average revenue based on that calculation; revenues that would have contributed significantly to gross farm income.
In addition to the changes in the farm economy and farm policy, the Seventies proved to be a complicated time for the American economy. Figure 5 illustrates some basic economic data for the time frame 1960 through 1985. Specifically, Figure 6 illustrates monthly interest rates, discount rate for the United States (not seasonally adjusted) from the Federal Reserve Bank of St. Louis, Federal Reserve Economic Data (FRED). It also illustrates the inflation rate and unemployment rate on a monthly basis as reported by the Department of Labor, Bureau of Labor Statistics (BLS Data Tools). Notably, inflation spikes in roughly the same years as the commodities price spike; inflation peaked in the Seventies at 11.7 percent in 1975 and went even higher to 13.6 percent in 1980.
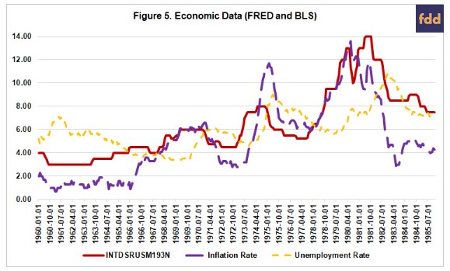
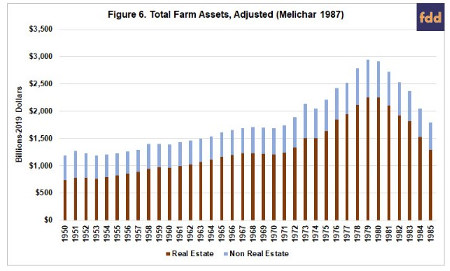
These economic indicators would impact the agricultural situation: interest rates would be costly to heavily-indebted farmers and inflation would increase both asset values as well as the cost to produce crops. They would have combined impacts on real estate as well, inflation increasing asset values, requiring increased borrowing at higher interest rates on inflated assets. Figure 6 illustrates the impact using data from the Federal Reserve System reported in 1987 (Melichar 1987). Note that the data reported in 1987 had been reported in 1986 dollars and have been adjusted to 2019 dollars using the Bureau of Labor Statistics Inflation Calculator (CPI Inflation Calculator). According to BLS, $1.00 in January of 1986 has the same buying power as $2.30 in January 2019.
Viewed from the depths of the Eighties farm crisis—as Congress wrestled with assisting farmers and bailing out the Farm Credit System—analysis of the problem concluded that farmers had borrowed too much on inflated assets (particularly land) but that income had not kept pace (Calomiris, Hubbard and Stock, 1986; Bullock, 1985). Figure 7 provides perspective on this conclusion, comparing the gross farm income and farm debt data. The data in Figure 7 are from the 1987 Federal Reserve System report (Melichar 1987). As in Figure 6, the numbers have been adjusted for inflation using the BLS CPI Inflation Calculator, from 1986 dollars to 2019 dollars.
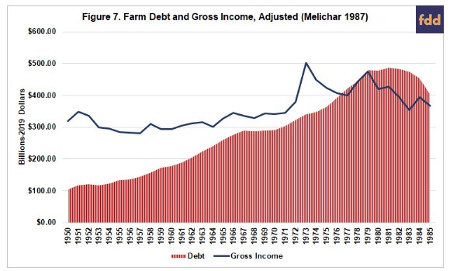
Clear in Figure 7, gross farm income spiked with the spike in commodities prices in 1972 and 1973 but farm debt kept growing steadily over time. As income began to fall after the spike, debt continued increasing at a steep pace, debt bypassing income in 1977. Debt remained above gross farm income through 1985. It provides a clear indicator of the unmanageable financial stress that was overwhelming many farmers and, eventually, the Farm Credit System. By 1985, estimates were that nearly a quarter of the farm debt could not be repaid from income (Bullock, 1985). Arguably, farmers were able to borrow too much (and at high interest rates) on the back of inflation which drove up the value of the land; asset inflation rather than repayment capacity fed the borrowing and as inflation, prices and incomes fell so did the value of the farmland leaving farmers with little ability to pay off the loans (Barnett 2000; Fite 1992; Harl 1990; Bullock 1985). The result was the farm economic crisis of the Eighties.
Concluding Thoughts
The 1970s provide an interesting and instructive case study, featuring a collision of economic, monetary, market, geopolitical, behavioral and policy issues to produce a massive economic crisis in agriculture. Changes in monetary policy, an embargo and a deal with the Soviet Union fueled a commodity price spike which, in turn, added pressure to the existing effort to revise farm policy and helped push Congress to make major changes in the 1973 Farm Bill. The farm economy became more dependent on export markets and the connected geopolitical issues they bring. At the same time farmers were encouraged to expand production for export market demand, as well as to increase the size of their operations; an effort assisted by inflation that helped farmers amass massive debt for this expansion. Buried within the data and figures discussed herein was another issue that began to appear on the Congressional radar in the late Seventies: farm consolidation and concerns about increasing corporate ownership of farming and commodity production. While it doesn’t show up in the aggregate data, the Senate Judiciary Committee was informed in a 1979 hearing that between 58 and 63 percent of all land transfers were for the expansion of existing farms and that in the Corn Belt, 75 percent of farm purchases were for expansion of existing farms (S. Rept. 96-42). Clearly the events of the 1970s provoked substantial—and often painful—change in American agriculture.
Source: farmdocdaily