By Carl Zulauf
Department of Agricultural, Environmental and Development Economics
Ohio State University
Gary Schnitkey and Jonathan Coppess et.al
Department of Agricultural and Consumer Economics
University of Illinois
A key pricing variable for US corn and soybeans planted in 2022 is the acres elected into crop insurance prevent plant program. US planting progress as of June 5 is assessed. Historical relationships estimate prevent plant acres in 2022 at 3.2 million for corn and 0.8 million for soybeans. These estimates are higher for corn but less for soybeans than their 2007-2021 average values.
Prevent Plant Overview
Prevent plant is a provision of publically subsidized individual farm yield and revenue insurance. Specifically, if an insured cause of loss, such as excessive moisture, delays planting to or after a date set by USDA, RMA (US Department of Agriculture, Risk Management Agency), a farmer has the decision to plant a crop or not plant a crop and take a prevent plant payment. The initial prevent plant date varies by region and crop. Prevent plant is, in effect, a conditional land set aside decision for the farmer triggered when an insured cause of loss delays planting until a date set by RMA. For in-depth discussion of prevent plant, see May 3, May 4, and May 13, 2022 farmdoc daily Articles.
Corn Prevent Plant
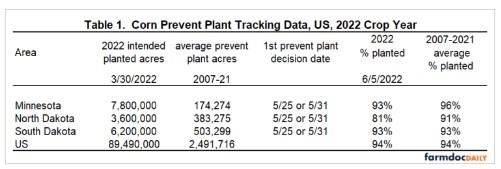
Despite a slow start (farmdoc daily May 18, 2022), US corn planting as of June 5, 2022 equaled the average percent planted by this date for the 2007-2021 crops (see Table 1). The same holds for South Dakota and Minnesota. In contrast, corn planting in North Dakota continues to lag noticeably. North Dakota accounts for 15.4% of US corn prevent plant acres reported by USDA, FSA (Farm Service Agency) since 2007 and 4.0% of intended US corn acres in the March 2022 acreage report. Corn prevent plant’s first decision date for most of North Dakota was May 25 (farmdoc daily May 3, 2022)
Soybean Prevent Plant
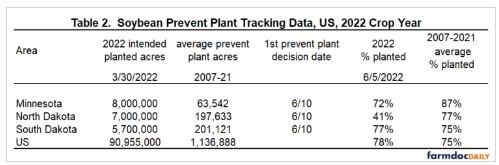
US planting of soybeans is slightly ahead of normal as of June 5, 2022 (see Table 2). The same holds for South Dakota. In contrast, soybean planting lags noticeably in Minnesota and, especially, North Dakota. North Dakota and Minnesota respectively account for 17.4% and 5.6% of US soybean prevent plant acres since 2007. They account for 8.8% and 7.7%, respectively, of intended US soybean acres in the March 2022 acreage report. Soybean prevent plant’s first decision date is June 10 for both states.
Planting Progress and Prevent Plant Acres
Linear regression is used to analyze year-to-year variation in US corn and soybean prevent plant acres since 2007. Explanatory variables are (1) the US planting progress at the end of first week in June (week 22 in USDA, NASS (National Agricultural Statistical Service) reports) and (2) a measure of the economic incentive to plant the crop. The latter is calculated as: (average US cash price for the main planting months of April, May, and June) divided by (US total cost of production divided by US trendline yield for the year). Planting progress, cash prices, and yields are from Quick Stats (USDA, NASS). Cost of production is from USDA, ERS (Economic Research Service). Estimation of trendline yield is discussed in Data Note 1. Average, minimum, and maximum values of the economic incentive variable were, respectively, 114%, 80% (in 2020), and 163% (in 2013) for corn and 117%, 78% (in 2019), and 157% (in 2008) for soybeans.
Because 2022 planting progress particularly lagged in Minnesota and North and South Dakota, planting progress in each of these states was added to the regression equation to assess if it would improve statistical significance of the equation. The only crop-state variable that significantly increased R2 explanatory power was North Dakota planting progress on corn.
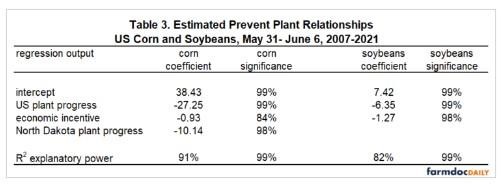
R2 explanatory power of the linear regression equations are 91% for corn and 82% for soybeans (see Table 3). As expected, the planting progress variables have a negative relationship, implying slower planting is associated with more prevent plant acres. Each planting progress variable is significant with at least 98% statistical confidence. The economic incentive variable is not statistically significant for corn at the conventionally used 95% level of statistical confidence, but, is statistically significant at 99% for soybeans. The mixed findings for the economic incentive variable suggest caution regarding the impact that market incentives to plant have on prevent plant decisions.
Using the reported planting progress as of June 5, 2022 and the economic incentive ratio calculated using available data for 2022 (see Data Note 2), 2022 prevent plant acres are estimated at 3.2 million for corn and 0.8 million for soybeans. Estimated prevent plant acres exceed the 2007-2021 average for corn but are less than the 2007-2021 average for soybeans (see Tables 1 and 2). These estimates need to be used with caution. There are only 15 observations with a notable outlier. Removing the large prevent plant year of 2019 results in estimates of 3.6 and 0.8 million corn and soybean prevent plant acres in 2022 (see Data Note 3). The averages without 2019 are 1.9 million for corn and 0.9 million for soybeans.
Summary Observations
Historical relationships suggest US corn prevent plant acres in 2022 are likely to be somewhat larger than normal while US soybean prevent plant acres are likely to be slightly less than normal.
History suggests that the lag in the planting of corn in North Dakota in 2022 is especially important.
While not a prevent plant issue per se, the North Dakota corn and soybean crop and the Minnesota soybean crop will have an elevated risk of damage from an early-to-normal frost.
Although explanatory power of the regression analysis is substantial, there are only 15 observations, suggesting caution.
Final reminders: (1) weather trumps any crop forecast and (2) history is a compass, not GPS tracking. Use accordingly.
Data Notes
- The corn and soybean trendline yield equations are estimated using yields per planted acre for the 1972 2021 crops. Corn acres planted for grain equals total planted corn acres minus acres harvested for silage. Corn’s trendline equation has an intercept of 77.97 bushels / planted acre with a +1.91 bushel / planted acre annual increase in yield. R2 explanatory power is 86%. Soybean’s trendline equation has an intercept of 24.05 bushels / planted acre with a +0.50 bushel / planted acre annual increase in yield. R2 is 88%.
- USDA, NASS has reported US prices only for April 2022: $7.08 for corn and $15.80 for soybeans. Given cash market price trends since then, the economic incentive to plant corn and soybeans in 2022 was estimated using a corn price of $7.50 and a soybean price of $16.50. USDA, ERS will not release updated cost of production estimates for 2022 until June 22. Therefore, the increase in total cost of producing corn and soybeans of 19% and 20%, respectively, in central Illinois between 2021 and 2022 (farmdoc daily April 12, 2022) were applied to the total cost of producing US corn and soybeans in 2021. Values of the economic incentive variable for 2022 was 157% for corn and 132% for soybeans. They are at the high end of historical values but are not the highest.
- Removing the 2019 observation results in this corn regression equation: prevent plant acres = 19.26 – 1.24 times US planting progress – 0.45 times economic incentive to plant – 17.02 times North Dakota planting progress; R2 explanatory power is 75%. The soybean regression equation is: prevent plant acres = 5.50 – 4.68 times planting progress – 0.79 times economic incentive to plant; R2 explanatory power is 56%.
Source : illinois.edu